
II. Analytical approaches to paleoliquefaction studies
Back-calculations using Liquefaction evaluation proceduresIII. Uncertainties in applying the analytical approachesCyclic stress methodBack-calculations using magnitude-bound methodSeismic demandOverview of Green and Mitchell's energy-based method
Liquefaction resistance (capacity)Seismic demandBrief discussion of the cyclic stress and energy-based methods
Liquefaction resistance (capacity)
Factors related to liquefaction susceptibilityIV. Recommended approach to paleoliquefaction studiesAgingFactors related to field observations, ground failure mechanism, and field setting
Density changes
Factors related to seismicity
Validity of in-situ testing techniques
Regional factors affecting paleoliquefaction studiesSeismological considerations
Geotechnical considerations
Field techniques for performing back-calculationsV. Discussion and conclusionsBracketing the properties of the source bed
Selecting a representative penetration resistanceEffect of changes in liquefaction susceptibilityBack-calculations using observations in sectional view
Interpreting multiple penetration tests
Back-calculations using observations in plan view
Table 1.Guidelines for Selecting a Representative Penetration Resistance Value
In studies that have been based on the cyclic stress method, paleoseismic interpretations often are subject to many uncertainties. These uncertainties include the unknown influence of aging effects on liquefaction susceptibility of the source beds (Olson et al., 2001) and the uncertainty inherent in the procedure. Still, this method has been used extensively for the analysis of paleoliquefaction effects, such as those from the 1811-12 New Madrid earthquakes (e.g., Schneider, 1999) and the 1755 Cape Ann, Massachusetts earthquake (Ellis and de Alba, 1999). Similarly, in the Pacific Northwest, Obermeier and Dickenson (2000) used the regional pattern of liquefaction effects in combination with the cyclic stress method to estimate the strength of shaking from the subduction earthquake of 1700 AD. Virtually all major paleoseismic studies that have attempted to back-calculate the value of pga (peak ground acceleration) at a site have been based either directly or indirectly on the cyclic stress method [including those that use the Ishihara (1985) and the Pond (1996) energy-stress methods].
In several important studies, paleoseismic interpretations have been based largely on the magnitude-bound method. For example, the range of liquefaction effects predating the 1886 Charleston, South Carolina earthquake (M ~ 7.2) was used in combination with the sizes of liquefaction features to demonstrate that previous events had been at least as strong as that of 1886 (Obermeier, 1993, 1996; Talwani and Schaeffer, 2001). In the Wabash Valley of Indiana-Illinois, Munson and Munson (1996), Pond (1996), and Obermeier (1998) have used this method to demonstrate that some of the prehistoric earthquakes there almost certainly exceeded M 7. In the New Madrid Seismic Zone of Missouri-Arkansas, Tuttle (1999) used the sizes and range of liquefaction features to show that some late Holocene earthquakes probably approached the strongest of the 1811-12 events, of M ~ 7.5 to 8. Still, the magnitude-bound method is limited by the need for calibration from historic earthquakes in the same tectonic setting.
Obermeier et al. (2001) recently summarized the geologic and field methods for paleoseismic interpretations as well as the principal analytical methods that are being used by the scientific and engineering communities-at-large. They provided an extensive discussion of the proper conduct for the geologic portions of a paleoseismic study, which we believe remains valid. In this paper we attempt to clarify and update several aspects of back-calculation techniques, as well as analysis and interpretation procedures.
First, we briefly describe analytical procedures used for back-analysis. Those discussed herein are the cyclic stress method, the Green-Mitchell energy-based method (Green, 2001), and the magnitude-bound method. Green (2001) recently developed and verified a new energy-based approach for liquefaction analysis, as an alternative to the cyclic stress method. This method, summarized herein, can be used for paleoseismic analysis to evaluate the values of pga-M combinations that are required to induce liquefaction at a site. The method eliminates some of the uncertainties inherent to the cyclic stress method.
Next, we present recommendations and procedures that reduce uncertainties inherent in the collection and application of field data for back-calculations. We address seismological and geotechnical issues that affect site selection, as well as field techniques that can be used to bracket potential source bed properties and assist in selecting a representative penetration resistance. We recommend methodologies for performing back-calculations and interpreting results at individual sites so as to reduce uncertainties. Finally, we recommend a regional approach for integrating and interpreting the results from back-calculations of individual sites.
We present below brief overviews of two liquefaction evaluation procedures, as they were developed for performing forward analyses. The first is the widely used cyclic stress method, while the second is a newly developed energy-based procedure.
Seismic demand. The damage potential of earthquake ground motions is a function of both the amplitude and the duration of earthquake-induced motions (i.e., demand), wherein the amplitude of the earthquake-induced demand is quantified in terms of cyclic stress ratio (CSR). CSR can be determined for any desired depth in a soil profile by either performing a numerical ground response analysis or by using the following equation:
|
|
[1] |
where τh,avg = average (equivalent) horizontal seismic shear stress ≈ 0.65τh,max; σ'vo = initial vertical effective stress; αmax = peak ground acceleration (pga); g = acceleration of gravity; σvo = initial vertical total stress; and rd = dimensionless stress reduction factor accounting for flexibility of the soil column.
Equation [1] constitutes the "simplified," or approximate, procedure to estimate the amplitude of earthquake-induced demand. The rd factor exhibits a wide range of values particularly at depths greater than 10 m, and the average value of the range is commonly used in engineering practice (Youd et al., 2001). However, numerous investigators suggest that the rd factors commonly used with the cyclic stress method can be far too large at depths less than 10 to 15 m, resulting in cyclic stress ratios that are too large (e.g., Nishiyama et al. 1977; Iwasaki et al. 1978; Maugeri et al. 1989; Hwang 1993; and Hwang et al. 1995). For example, analyzing seismic data from the Lotung and Hualien, Taiwan Large Scale Seismic Testing (LSST) downhole array sites, Hwang et al. (1995) showed that rd at a depth of 6 m can be as much as 25% smaller than the average value recommended by Youd et al. (2001).
Alternately, values of τh,max with depth can be determined by numerical ground response analyses, thus avoiding the use of the rd factors. However, ground response analyses require the selection or synthesis of representative ground motion time histories, for which the M and pga are yet unknown (i.e., the purpose of performing the paleoliquefaction study is to determine the pga-M combination). Additionally, we note that a large body of literature exists regarding the merits and shortcomings of equivalent-linear and non-linear ground response analyses and various numerical codes. Accordingly, an investigator should have a solid understanding of these issues prior to using any ground response program for paleoseismic analysis.
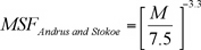
The duration of ground shaking is typically correlated to earthquake magnitude via magnitude scaling factors (MSF). MSF are inversely proportional to the square root of duration of strong motion (Green and Mitchell, 2003) and are presented in reference to M 7.5 events. Numerous correlations for MSF have been proposed, as shown in Figure 1. Youd and Idriss (1997) and Youd et al. (2001) describe the development of these relationships. As may be observed from this figure, the MSF vary greatly at all magnitudes, and particularly at magnitudes less than about 6.5.
At present, no clear consensus exists among the geotechnical earthquake engineering community as to which of the proposed MSF relations is most correct. However, the MSF relations proposed by Seed and Idriss (1982) and by Andrus and Stokoe (1997) are commonly used, expressions for which are given below.
|
|
[2a] |
|
[2b] |
In addition to MSF, the effect of overburden pressure on liquefaction resistance is incorporated in the cyclic stress method using the factorKσ.Kσ adjusts the liquefaction resistance of a soil to the comparable value at one atmosphere effective confining stress. As discussed in Youd and Idriss (1997),Kσ is a function of the relative density of the soil, as well as the initial effective confining stress. Youd et al. (2001) provide relationships forKσ at various values of relative density. The following expression constitutes the "simplified" approach to estimate seismic demand.
|
|
[3] |
Note that whileKσ actually applies to liquefaction resistance, it may be used to adjust the seismic demand, as above. Additionally, it should be noted that Eq. [3] applies only to free-field, level ground sites (i.e., slopes less than 6%).
Liquefaction resistance (capacity). In the cyclic stress method the capacity of the soil (or liquefaction resistance) is quantified in terms of cyclic resistance ratio (CRR). Empirical correlations relating CRR to in-situ properties [e.g., SPT (N1)60, CPT qT1, or shear wave velocity Vs1] were developed through the analysis of earthquake case histories. Sites containing sandy soils that were subjected to known (or reasonably estimated) earthquake motions were categorized as liquefied and non-liquefied, largely on basis of the presence or absence of surficial liquefaction features (e.g., sand boils). For each case history, the seismic demand was estimated using Eq. [3] and plotted as a function of the penetration resistance of the soil. The boundary giving a reasonable separation of the liquefied and non-liquefied points defines the CRR (or capacity curve). Figure 2 presents one such relationship using SPT-based case histories.
Following an analogous procedure, Stark and Olson (1995) developed a CRR boundary using cone penetration test (CPT) data. Similarly, Andrus and Stokoe (1997) developed a CRR boundary using small strain shear wave velocity data.
The factor of safety against liquefaction (FSliq) is defined as the ratio of liquefaction resistance (or capacity) to seismic demand.
|
|
[4] |
Liquefaction is predicted whenFSliqis less than or equal to unity.
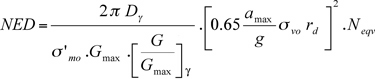
Seismic demand. In this procedure the seismic demand imposed on the soil is quantified in terms of normalized energy demand (NED), which is the area bound by the shear stress-strain hysteresis loops (ΔW), divided by the initial mean effective confining stress (σ'mo). NED can be determined either by performing a numerical ground response analysis or by using the following "simplified" expression.
|
|
[5] |
where ΔW1 = the energy dissipated in one equivalent cycle of loading; σ'mo = the initial mean effective confining stress; and Neqv = the number of equivalent cycles. Using the principles of visco-elasticity, as outlined in Green (2001), Eq. [5] can be rewritten as:
|
[6] |
where the previously undefined terms are: Dγ = viscous damping ratio at the shear strain γ; Gmax = secant shear modulus corresponding to γ ≤ 10-4%; and (G/Gmax) γ = ratio of secant shear moduli corresponding to γ and γ ≤ 10-4%, respectively.
Because both D and G/Gmax are functions of shear strain, the determination of the earthquake-induced shear strain is central to using Eq. [6]. Green (2001) adopted the iterative approach proposed by Dobry et al. (1982) to determine strain compatible values of D and G/Gmax. Starting with the relation between stress and strain γ = τ /G, Dobry et al. (1982) derived the following expression:
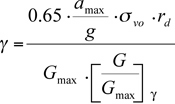
|
[7] |
Using (secant) shear modulus degradation curves such as those proposed by Ishibashi and Zhang (1993), Eq. [7] is solved iteratively as illustrated in Figure 3. For the first iteration, a value of G/Gmax is assumed and γ is then computed. In the second iteration the ratio of G/Gmax corresponding to the value of γ that was computed in the first iteration is used. The process is repeated until the assumed and computed ratios are within a tolerable error. The shear strains determined by this procedure are analogous to those computed using "total stress" ground response computer programs (e.g., SHAKE'91). Accordingly, the reduction of the secant shear modulus of the soil relates only to the inherent non-linear behavior of the soil at a given effective confining stress and does not reflect or include the influence of shaking-induced excess pore pressures. Once γ is determined, the damping and shear modulus ratios are easily determined from the respective degradation curves, as illustrated in Figure 4.
The remaining unknowns in Eq. [6] are Gmax and Neqv. Various correlations have been proposed for Gmax, one of which is that given in Seed et al. (1986) relating Gmax and (N1)60:
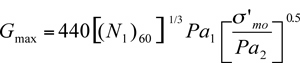
|
[8] |
where Pa1 and Pa2 are atmospheric pressure having the same units as Gmax and σ'mo, respectively. For these calculations, Green (2001) estimated σ'mo using empirical correlations relating penetration resistance to the ratio of horizontal to vertical effective stress (Ko). However, Ko may be assumed reasonably to be 0.5. Finally, Green (2001) analyzed data from a series of ground response analyses and developed a correlation relating Neqv to earthquake moment magnitude (M) and epicentral distance (Re). Figure 5 presents the correlation.
Liquefaction resistance (capacity). Using an analogous approach to that used to develop the correlation relating CRR and (N1)60 shown in Figure 2, Green (2001) developed a capacity curve for the energy-based procedure via the analysis of liquefaction case histories. Sites containing sandy soils that were subjected to earthquake motions were categorized as liquefied and non-liquefied. For each of the case histories, the seismic demand was estimated using Eq. [6] and plotted as a function of the normalized penetration resistance of the soil. Figure 6 presents the normalized energy capacity (NEC) boundary that gives a reasonable separation of the liquefied and non-liquefied data. As with the cyclic stress liquefaction evaluation procedure, liquefaction is predicted where the ratio of capacity to demand is less than or equal to unity.
As indicated by Green (2001), one advantage that the Green-Mitchell energy-based method has over the cyclic stress method is that it circumvents the need for MSF andKσ, both of which introduce considerable scatter (or uncertainty) into the cyclic stress approach.
Although the Green-Mitchell energy-based procedure relies on a correlation relating M, site-to-source-distance, and Neqv (Figure 5), which may be viewed as being analogous to MSF, the approaches used to derive the correlation shown in Figure 5 and MSF are fundamentally different, with the former resulting in considerably less scatter. Green (2001) derived the correlation in Figure 5 from numerical ground response analyses using rock outcrop motions for a range of earthquake motions that were recorded at varying site-to-source distances, with most of the motions being from western U.S earthquakes having shallow focal depths. For other tectonic settings (e.g., subduction zones), correlations relating M, site-to-source-distance, and Neqv can be developed from representative acceleration time histories, either recorded or synthetic.
Finally, the Green-Mitchell procedure is only one of a plethora of energy-based liquefaction evaluation procedures that have been proposed in literature, with the procedure proposed by Law et al. (1990) having been used in several paleoliquefaction studies (e.g., Pond and Martin 1996). Law et al. (1990) defined the seismic demand (T) imposed on the soil using the following expression.
|
|
[9] |
where R = hypocentral distance in km. This expression relates to the elastic energy of the seismic waves arriving at the site, rather than energy dissipated through friction as a result of the interparticle movement of the sand grains. The Green-Mitchell procedure uses the latter definition of energy (that is., dissipated energy) because it relates directly to the breakdown of soil structure and therefore is closely related to the liquefaction phenomenon. Green (2001) presented a detailed critique of Law et al. (1990) and other energy-based procedures.
As discussed by Obermeier et al. (2001), back-calculations using the magnitude-bound method should be based on regional correlations, as opposed to correlations derived from worldwide data, because the factors that control the greatest distance from the earthquake source at which liquefaction occurs are regionally dependent. These factors include: (1) earthquake source characteristics; (2) transmission characteristics, and (3) regional soil liquefaction susceptibility. For example, Obermeier et al. (1993) and Pond (1996) showed that for the central United States the moderate liquefaction susceptibility of the regional sediments limits the farthest distance to liquefaction for moderate earthquakes (M < 6.8), as compared to Ambraseys' (1988) worldwide bound. In contrast, for large earthquakes (M > 7), the regional transmission characteristics of the central and eastern U.S. (CEUS) extend the farthest distance to liquefaction beyond Ambraseys' bound.
Thus, when using the magnitude-bound method for paleoseismic back-analysis, investigators must consider several issues. These issues include: (1) determination of energy center for paleoearthquakes; (2) accounting for regional source and transmission characteristics, as well as liquefaction susceptibility; and (3) the effort and methods used in the field investigation to locate the most distant site of liquefaction. Obermeier et al. (2001) present a detailed discussion of the first two factors noted above. Subsequent sections of this paper expand on the effort and methods used to locate the most distant site of liquefaction.
Mesri et al. (1990) indicated that freshly deposited and/or densified clean sands exhibit substantial increases in penetration resistance during drained secondary compression, especially in the first several months (i.e., first few log cycles of time following the end of primary consolidation). After that time the rate of increase decreased greatly. Doubling and tripling of penetration resistance occasionally was noted during this initial period. We suspect that it is because of this rapid recovery in penetration resistance that the relations in Figure 2 (collected within a few years after the causative earthquake) are at least approximately correct for engineering design. And, we believe that secondary compression effects are virtually complete within a few hundred years or so (e.g., see laboratory data in Mesri et al., 1990).
Still, with the passage of thousands of years there is a further substantial decrease in liquefaction susceptibility in many field settings (e.g., Youd and Perkins, 1978, Table 2). For example, Youd and Perkins indicate in their table that river channel deposits will likely decrease in liquefaction susceptibility from "very high" to a value of "high," through Holocene time. Similarly, dune deposits will decrease from "high" to a value of "moderate." As suggested by Terzaghi et al. (1996), we suspect that a portion of this increase in liquefaction resistance is in response to preshearing resulting from applications of low-level seismic shaking (i.e., too low to have caused significant porewater pressure increase or liquefaction).
The authors are not aware of any field data that prove the effect of preshearing occurs in-situ, but there are ample laboratory data demonstrating this phenomenon (e.g., Finn et al., 1970; Bjerrum, 1973; Lee and Focht, 1975; Seed et al., 1977; Vaid et al., 1989). For example, Seed et al. (1977) used large-scale shaking tests to examine the effect of preshearing on the liquefaction resistance of Monterey 0 sand. They showed that preshearing under low-level shaking increased the liquefaction resistance by more than 40% at 15 cycles of shaking, while the corresponding increase in relative density was only 1% (from 54% to 54.7%). Similarly, Vaid et al. (1989) tested Ottawa C-109 sand at an initial relative density of 36% to examine preshearing effects. Vaid et al. showed that the number of shaking cycles (at τ/σ'1c = 0.125; where σ'1c is the major principal effective stress after consolidation) required to trigger liquefaction increased from 14 with no preshearing, to 38 with 0.1% axial strain due to preshearing, and to 125 with 0.2% axial strain due to preshearing.
As these laboratory tests suggest, preshearing would produce nearly imperceptible settlements at the ground surface. However, these slight movements at the particle contacts produce better interlocking among grains and a significant increase in liquefaction resistance. Therefore, in the time range of more than a few hundred years, and where cementation is not present, the net effect of preshearing and secondary compression is most typically an increase in penetration resistance and correspondingly a decrease in liquefaction susceptibility.
The contribution of cementation to aging undoubtedly increases liquefaction resistance in many field settings, especially where the level of the watertable fluctuates. This fluctuation can permit precipitation of compounds such as carbonates and the development of oxides through the zone above the watertable. However, this process is typically important only above the lowest level of the watertable.
The actual changes in liquefaction susceptibility that take place through time can vary greatly from geographic region to region. For example in coastal South Carolina, Martin and Clough (1994) found that the liquefaction susceptibility of many beach deposits older than 80,000 years remains high to very high; the reasons for the persistence of this exceptionally high susceptibility are uncertain. Thus, for paleoseismic analysis, it is apparent that the effects of aging can be either large or very small, and must be evaluated on a case-by-case basis.
In the following discussion, we use changes in penetration resistance from ground modification programs to illustrate changes in liquefaction resistance that can occur. Mesri et al. (1990) compiled data that demonstrate the potential changes in penetration resistance from before and after ground modification (see Figure 9). Figure 9 illustrates that immediately following modification (i.e., less than 30 days) the post-disturbance penetration resistance may be higher or lower than the pre-disturbance value (with the value of one on the ordinate being the pre-disturbance value), depending on the percentage change in void ratio, ΔeR. (The value ΔeR can be shown to be equivalent to the percentage change in relative density, ΔDR.) Most sites that experienced a large change in relative density (i.e., significant settlements due to disturbance) exhibited a post-disturbance penetration resistance greater than the pre-disturbance value. In contrast, all sites shown in the figure that experienced smaller changes in relative density exhibited a post-disturbance penetration resistance that was smaller than the pre-disturbance value. Olson et al. (2001) discussed this concept in detail.
While the magnitude of the change in penetration resistance resulting from ground modification may differ from that resulting from liquefaction, the pattern of changes observed by Mesri et al. (1990) suggests that post-earthquake penetration resistance can be higher or lower than the pre-earthquake value, depending on the magnitude of density change. In turn, the magnitude of density change strongly depends on the severity of liquefaction and duration of strong shaking. Whereas an increase in post-earthquake penetration resistance can occur at sites of severe liquefaction, a temporary post-earthquake decrease can occur at sites of marginal or moderate liquefaction. However, we believe that it is likely that only minor changes in penetration resistance from the pre-earthquake values should remain at many (and likely most) sites of marginal liquefaction by the time in situ measurements are made. Our reasoning is that at sites of marginal liquefaction, reconsolidation will be completed quickly (on the order of hours to days) resulting in secondary compression starting shortly after the earthquake. In this case, the post-earthquake penetration resistance will recover very quickly.
We note that the above discussion applies to clean sands. Density changes in silty sands and sandy silts resulting from ground modification or liquefaction are less predictable (e.g., Green, 2001).
The data in Figures 2, 6, and 8 incorporate all mechanisms of ground failure -- hydraulic fracturing, lateral spreading, and surface oscillations. However, the ground failure mechanism may control whether or not surface manifestations develop for some field settings and for some intensities of earthquake shaking (examples are discussed in detail by Obermeier et al., 2001). For example, liquefaction features at level sites (e.g., hydraulic fracturing) may not manifest at the surface where the fine-grained cap is relatively thick or where the watertable is located below the top of the stratum that liquefied. Accordingly, it is likely that some of the data points in Figure 2 and 6 that are designated as sites of "no liquefaction' did, in fact, experience liquefaction. Similarly, liquefaction likely occurs beyond the farthest site-to-source distance that is used for the magnitude-bound method (Figure 8), but such occurrences are not discernable in plan view.
Another major factor contributing to a non-distinct transition from sites of liquefaction to those of no liquefaction in Figures 2 and 6 is caused by the inability to determine which stratum actually liquefied. The data presented in Figures 2 and 6 were determined almost exclusively from sediment samples taken from borings, in conjunction with judgment. In many cases, only the most susceptible strata could confidently have been assumed to liquefy (e.g., Fear and McRoberts, 1995).
Still, considering all factors that were used in development of the boundary curves in Figures 2, 6, and 8, we believe that for back-analysis of paleoseismic shaking the curves should be used in their present versions. Only with extensive further research can the curves be modified with confidence, because different factors related to the observed field occurrence of liquefaction cause the curves to be shifted in different directions.
In addition to the uncertainty associated with estimating the amplitude of the demand, estimations of ground motion duration, as represented in terms of "equivalent number of cycles" (i.e., MSF in the cyclic stress method) also may be highly uncertain (e.g., see Figure 1). This is evident from the large scatter in the data presented in Seed et al. (1975) relating earthquake magnitude to equivalent number of cycles and in the range of proposed MSF from various studies (e.g., Youd and Idriss, 1997). Additionally, there is uncertainty in applying MSF that were developed from a compilation of ground motions from western U.S. and Japanese earthquakes to other tectonic settings, such as the CEUS.
We suggest that a possible explanation for the lack of measurable difference in penetration resistance at the South Carolina sites may be the presence of weak cementation or weak aging effects in the source sand beds. Our rationale is as follows. In-situ penetration testing methods such as the SPT and CPT induce very large strains in the soil prior to passage of the equipment in the ground. As a result, at sites of no liquefaction, weak bonds at particle contacts that remained intact during seismic events may be disrupted by the large strains that precede the penetrating equipment. However, as a result of destroying the weak effects, there may be little difference in penetration resistance at a site of liquefaction and an adjacent site of no liquefaction. Non-destructive shear wave velocity testing may provide a means to assess the presence of cementation at such sites. However, shear wave velocity should not be used for back-analysis at these sites because liquefaction resistance relationships using shear wave velocity data were developed using case history data almost exclusively from sites having young, uncemented sandy soils (Andrus and Stokoe, 1997). In such locales, back-calculations can only be made at liquefaction sites (i.e., sites of no liquefaction cannot be used to provide upper limits), resulting in greater uncertainty in back-analysis results.
Lastly, it is not unusual that marginal liquefaction effects are the result of liquefaction of a thin stratum. (We provide a definition of marginal liquefaction in Section IV.) Thus, one must consider whether the tools that are being used for assessment of liquefaction susceptibility, especially the SPT and shear wave velocity methods, can accurately assess the source bed properties. The sampling spoon for the SPT typically is about 60 cm long, which means that as much as 60 cm of soil are in contact with the sampler and directly influence the SPT value. In addition, Robertson and Wride (1997) suggest that a sphere of soil up to 2 or 3 times the diameter of the SPT sampler can influence penetration resistance in soft soils, whereas the sphere of influence can be up to 20 diameters in stiff soils. However, because of the influence of the length of the sampler in contact with the soil, the effective diameter controlling the sphere of influence may be greater than the actual diameter of the sampling spoon. In other words, in soft soils the SPT N-value is influenced by a sphere of soil with a diameter ranging anywhere between from 11 cm (twice the actual diameter of the spoon) to 1.8 m (3x the length of the sampler).
Measurement of shear wave velocity (Vs) by crosshole or downhole methods is limited by practical considerations of borehole conditions (i.e., casing/grout/soil continuity, stiffness compatibility of grout and soil, borehole verticality, etc.), spacing of measurements, and spacing and number of boreholes used for measurements (in the crosshole method). For example, as the spacing of boreholes increases in the crosshole method, the apparent shear wave velocity in soft soils increases considerably (e.g., ASTM D 4428/D 4428M). However, the accuracy and resolution of crosshole tests is generally constant with depth, with a highest resolution of about 60 cm. Downhole measurements (including those made using the seismic cone penetration test) are subject to considerable interpretation, and these interpretations are greatly complicated by multilayered subsurface profiles (e.g., Lodge El-Telbany et al., 1996). For example, using downhole methods it may be possible to resolve a 1-m thick layer that exhibits a 50% shear wave velocity contrast to the surrounding layers, but it may not be possible to resolve a 3-m thick layer with a 20% velocity contrast (personal comm., T.J. King, URS Corporation, 2002). Spectral analysis of surface waves (SASW) eliminates some of the practical issues involved with borehole measurements, but getting reliable results depends on procedural details and requires expert operation and interpretation. In addition, SASW resolution decreases significantly with depth and has a finest resolution of about 0.3 to 1 m. Suspension logging provides very high resolution (as fine as 20 to 30 cm, at least in soil deposits), is performed in a single borehole, and can be conducted to great depths (up to about 600 m) -- offering many advantages over other methods. It should be noted that values of Vs measured using suspension logging and the crosshole method may differ by up to about 30% over a small depth range at a single site (Owen and Roblee, 2000). Differences with other methods may be greater. In practice, the smallest discernible layer thickness is generally considered to be about 1 m, and the thinnest layer identified in the Vss-based liquefaction database is 1.2 m (Andrus and Stokoe, 1997).
Clearly the CPT method offers advantages for analysis of marginal liquefaction sites, although the CPT also has limitations for very thin layers, both soft and stiff (Lunne et al. 1997; Robertson and Wride 1997; Vreugdenhil et al. 1994). Robertson and Wride (1997) suggested that the minimum layer thickness for which the CPT can provide an accurate penetration resistance is approximately 7 to 11 cm in soft soils. The minimum thickness increases considerably in stiff soils, to as much as 70 cm. At marginal liquefaction sites, potentially liquefiable soils often are loose to medium dense, suggesting that the minimum identifiable layer thickness is somewhere between 7 and 70 cm, perhaps in the 20 to 30 cm range.
Obermeier et al. (2001) discussed items 2 through 4 in detail, although additional thoughts regarding the magnitude-bound method are described above. In the balance of this paper, we focus on the remaining tasKσ of the proposed approach. In a companion paper (Green et al., in prep.), we illustrate steps 5 and 6 using case history examples.
At the "planning" level, we subsequently discuss regional factors that affect site selection, data interpretation, and details of back-analysis that must be considered prior to the field conduct of a paleoliquefaction study. We divide these regional factors into seismological and geotechnical issues.
Our recommended approach for collecting field data for back-calculations is primarily to use sites of marginal liquefaction that are distributed over a wide area to the extent possible. A site of marginal liquefaction typically only has minor liquefaction-induced effects, which can be manifested in a number of ways depending on the method of observation. In plan view (e.g., looking down from above at a feature on the ground surface), there can be sparse and/or small sand boils, minor settlements (less than a few inches), minor lateral spreading (on the order of centimeters, not tens of centimeters or meters), or minor ground cracking that could be associated with liquefaction. In sectional view (e.g., looking at the cross-section of a feature exposed in a river bank), there can be development of small sills along the base of an overlying fine-grained cap or small (i.e., thin) dikes that may or may not have extended to the ground surface at the time of the earthquake. Sites of more severe liquefaction and no liquefaction also should be used, but field effort and interpretation should be focused on sites of marginal liquefaction.
By using the field data, back-calculated combinations of M and pga at individual sites are then compared with appropriate regional acceleration attenuation models in order to estimate the actual value of earthquake magnitude. This procedure was first used by Pond (1996) for the Wabash Valley of Indiana-Illinois to demonstrate that M~7.5 earthquakes had struck the region in mid-Holocene time. In the following sections, we present our recommended approach, which greatly expands upon and refines the technique first used by Pond (1996).
It may be necessary in some seismological settings to consider the possibility of significant focusing of seismic energy within the bedrock, especially for larger magnitude earthquakes (i.e., greater than M~7). For example, it is well known that strike-slip faulting can cause the strength of shaking to be much higher along the strike of the fault than elsewhere; for thrust faulting, the upthrown block will likely have the stronger shaking. Selected attenuation models for back-calculation should address these issues. Furthermore, locales for paleoliquefaction searches can be selected on the basis of this information in order to improve the chances of encountering candidate sites for back-calculation.
In addition, an investigator must be aware that attenuation models, which typically are based on small historic earthquakes in the region (at least for regions like the CEUS where large earthquakes occur infrequently), show only the largest values of peak acceleration that are predicted for larger magnitude earthquakes. Furthermore, the nature of shaking is likely to be much more random within the meizoseismal zone, in comparison to beyond. Attenuation models are unable to account for this random variability at small site-to-source distances.
Another factor that may significantly influence back-calculation results is amplification (or deamplification) of bedrock motions in alluvial deposits. Predicting ground motions in very thick alluvium (e.g., many hundreds of meters) can lead to significant errors, as is well known. Furthermore, selecting (and modifying) existing records or generating synthetic time histories for use in ground response analyses involves considerable uncertainty, particularly for regions like the central United States where strong ground motions have not been measured for earthquakes exceeding about M 5. Experienced seismologists should participate in the selection and development of acceleration time histories if a ground response analysis is undertaken. Thus, to the extent possible, site selection and back-calculations should be done so as to minimize the unknowns associated with the ground response analysis. Where possible, one approach is to conduct geotechnical testing at some sites having thick alluvium, and some at nearby sites having thin alluvium.
As a result of these seismological and geotechnical uncertainties, paleoliquefaction sites that are selected for detailed testing should be located preferentially throughout the region of strongest shaking beyond the meizoseismal region (as was done by Pond, 1996). Selecting sites located beyond the meizoseismal region can reduce many of the aforementioned uncertainties. Detailed testing at sites located within the meizoseismal region should involve testing at many sites. This practice will allow an investigator to identify anomalous back-calculation results.
The recommended approach is designed to bracket the influence of liquefaction on changes in the key properties of the source bed (i.e., density and aging effects) from the pre-earthquake condition. Test sites can be observed in either sectional or plan view; however, the method of site selection (i.e., sectional or plan view) can influence the interpretation of representative penetration resistance and the level of uncertainty associated with the back-calculation. Below, we provide recommendations for the interpretation and selection of a representative penetration resistance for various field settings. In addition, we provide recommendations for the interpretation of site conditions and back-analysis results for sites investigated in both sectional and plan view.
In developing this approach, we presumed that in most cases the following sequence of events occurs in response to seismic shaking: (a) breakdown of pre-existing aging effects; (b) liquefaction; (c) densification; and then (d) redevelopment of aging effects. Item (d) is time dependent and presents several possibilities, which we qualitatively account for by consideration of the relative ages of the liquefaction features and those of the host sands. The approach applies where a site of marginal liquefaction effects is juxtaposed with a site having no liquefaction effects, and, in addition, sediments at both sites were laid down in response to the same sedimentary processes operating essentially at the same time. That is, the site of liquefaction effects is basically a lateral extension of the site having no liquefaction effects. Employing a similar framework, sites of more severe liquefaction can also be used.
For back-analysis, one generally cannot a priori determine which strata actually liquefied, even with excellent exposures of possible source strata in sectional view. One can only observe where fluidization effects occurred. (Fluidization is the process whereby sediment is transported by flowing water. This flowage is caused by elevated pore-water pressure in response to processes such as static artesian conditions or seismic liquefaction. See Obermeier (1996) for a more complete discussion of the process.) Typical effects of fluidization include development of dikes and sills along the base of an overlying fine-grained cap, and development of sand boils when sand is carried to the ground surface. However, there are field situations, especially those involving marginal liquefaction, where it is difficult or impossible to visibly determine which strata actually liquefied, because the fluidization effects are so difficult to detect using the naked eye. Whether fluidization occurred within a particular stratum may be discernible only by CT-scan imaging or similar processing on undisturbed samples (e.g., Hurst and Cronin, 2001). But even if small fluidization effects are visible by such an analysis, it is generally difficult to determine whether those effects formed by processes active during initial deposition, having nothing to do with seismic shaking (e.g., see Figures 33 and 34 in Obermeier, 1996).
Generally the only means for determining whether strata were marginally liquefied is by in-situ testing of possible source beds at side-by-side sites, with one site having what appears to be marginal liquefaction effects and the other none. This allows the investigator to bracket the properties of the source bed in terms of factors and conditions that influence penetration resistance and similarly influence liquefaction resistance. Fortunately, in many field settings the beds having the highest likelihood of liquefying lie directly beneath or very close to an overlying fine-grained cap. This is due mainly to relations between liquefaction susceptibility of sediments as well as to the nature of seismic shaking through an alluvial column. When using observations in sectional view, the large contrast in permeability between a cap and underlying sand strata enhances development of fluidization effects, often making it relatively easy to select strata that are candidates for having liquefied.
In summary, identifying the source bed that liquefied (particularly at sites with only plan view observations) requires that multiple in-situ tests be conducted in proximity to an identified liquefaction feature, as illustrated in the companion paper (Green et al., in prep.) by means of using actual field data.
Effect of changes in liquefaction susceptibility. Both the SPT- and CPT-based liquefaction resistance relationships (e.g., Figures 2 and 6) employ field case history databases that were collected almost exclusively after the causative earthquake, both at sites of liquefaction and no liquefaction (T.L. Youd, written comm., 1999; Olson and Stark, 1998). These data typically were collected some months after the earthquake, and almost always within several years. The penetration resistance data were not modified in any way to correct for the effects of liquefaction or earthquake shaking. However, it was the pre-earthquake sediment properties that controlled whether or not liquefaction occurred when the earthquake struck. The difference between the pre-earthquake and post-earthquake liquefaction susceptibility can be significant in many cases, but is probably small in many others depending on the magnitude of density change (i.e., the severity of liquefaction) and the influence of post-earthquake aging (Olson et al., 2001).
Because the data used to develop the Figures 2 and 6 were collected after the earthquake, any changes in density upon liquefaction are already reflected in the penetration data. Thus, at liquefaction and no liquefaction sites there is no need to compensate for changes in density from the pre-earthquake condition when using these relationships (and similar CPT- or Vs-based relationships) for back analyses.
An assessment of the post-earthquake liquefaction susceptibility at a specific site also requires consideration of potential aging effects of the source bed. Based on our previous discussion of post-earthquake aging, we believe that it is reasonable to assume as a first approximation that any changes in penetration resistance at sites of marginal liquefaction have been recovered as a result of post-earthquake aging. Using a regional assessment of sites will clarify the validity of this assumption for individual sites. At sites of more severe liquefaction observed in sectional view, or at any site of liquefaction observed in plan view, potential changes in penetration resistance, and thus in liquefaction resistance, need to be considered on a case-by-case basis using the discussion presented herein as guidance.
Interpreting multiple penetration tests. Selecting a representative penetration resistance from multiple in-situ tests at a site involves engineering and geologic judgment. The investigator must consider the thickness and lateral continuity of the suspected source bed, the method of observation, and the ground failure mechanism, among others factors. Some of these factors and considerations are discussed below.
The thickness of the source bed has two primary impacts. First, in-situ tests have limitations in their ability to detect thin layers, as we discussed in Section III. Where thin layers are present, the true material properties may not be measured due to the influence of surrounding layers, whether softer or stiffer. Furthermore, the investigator must consider whether the suspected thin layer was capable of causing the postulated failure mechanism. For example, a single, thin liquefiable layer may not be capable of producing a sufficient volume of water or magnitude of excess porewater pressure to trigger hydraulic fracturing (see Green et al., in prep.). On the other hand, the same thin layer may be capable of causing lateral spreading.
In-situ tests must be conducted close enough to the observed feature to provide reasonable assurance that the measured properties represent the properties of the suspected source bed. For example, the limited lateral continuity of sand deposits of small, braided streams may require that penetration tests be conducted within a few meters of the observed feature.
In general, for studies of marginal liquefaction features conducted in sectional view, we suggest that the minimum penetration resistance of the source material [in terms of (N1)60 or qT1, etc.] from each penetration test be used for back-calculation. In sectional view, the size and extent of marginal liquefaction features often are readily evaluated, allowing penetration test locations to be selected and "liquefaction/marginal liquefaction/no liquefaction" designations to be assigned.
For studies at any liquefaction site in plan view and at sites of severe liquefaction in sectional view (particularly sites of lateral spreading), the size and extent of liquefaction effects at depth cannot be readily determined from a single boring or a few borings. Multiple in-situ tests are generally necessary within a very localized area to evaluate candidates for a source bed(s). In order to make a reasonable estimate of the lower limit of the strength of shaking at a site, but not an estimate of the extreme lower limit, we suggest using the value of penetration resistance corresponding to the highest minimum liquefaction susceptibility that is common to the data from multiple tests in proximity to the liquefaction feature(s). In other words, we suggest using the highest (or reasonably highest) minimum value of normalized penetration resistance common to multiple tests. To illustrate this method, assume penetration tests are performed at six individual test locations at a site of liquefaction along a streambank exposure several hundred meters in length. If the individual penetration tests yield minimum (N1)60 values of 7, 11, 12, 13, 6, and 12, we would suggest using a value of about 12 for the exposure, as a whole, assuming that aging effects are negligible. This selected value would also be subject to the proviso that the field setting be relatively uniform along the streambank exposure. In a companion paper, Green and others (in preparation) provide additional discussion and field examples of this assessment.
Obviously, an assessment of the engineering and geologic data at the site is required to screen penetration resistance values that are too large. For example, based on the work of Bartlett and Youd (1992), we suggest that sandy soils with (N1)60 values greater than about 15 to 20 generally do not produce lateral spreads beyond the meizoseismal zone.
As alluded to in the previous paragraph, the ground failure mechanism can also influence the selection of a representative penetration resistance value. For example, the areal extent of liquefaction may be much smaller to trigger hydraulic fracturing than to trigger extensive lateral spreading. In light of this effect, Table 1 provides general guidelines for selecting a representative penetration resistance value from multiple tests.
Table 1. Guidelines for Selecting a Representative Penetration Resistance Value
|
Ground Failure Mechanism |
Sectional View Observations of Marginal Liquefaction |
Plan View Observations (any severity of liquefaction) and Sectional View Observations of Severe Liquefaction |
|---|---|---|
|
Hydraulic fracturing |
Designate individual penetration tests as locations of marginal liquefaction or no liquefaction based on proximity to observed liquefaction features. Use lowest value of penetration resistance at each test location. |
Use highest minimum value of penetration resistance that is common among multiple penetration tests performed in proximity to individual liquefaction features created by hydraulic fracturing. |
|
Lateral spreading |
Designate penetration tests within the probable limits of lateral spread as marginal liquefaction. Designate tests outside these limits as no liquefaction. Use highest minimum value of penetration resistance common among multiple tests for each designation. |
Use highest minimum value of penetration resistance that is common among penetration tests scattered along the length of the lateral spread (regardless of their proximity to venting features). This length can be hundreds of meters at places subjected to strong earthquake shaking. |
|
Surface oscillations |
Same as for hydraulic fracturing. Penetration tests should be performed within a few meters of observed liquefaction feature. |
Use highest minimum value of penetration resistance that is commonly present (and typically near the base of the fine grained cap) and is located within a few tens of meters of the dikes caused by surface oscillations. |
|
Indeterminate mechanism |
Same as for hydraulic fracturing |
Use lowest value of penetration resistance that is realistically feasible for any of the three candidate mechanisms shown above. |
The scenarios enumerated below describe many of the possibilities that might be encountered at sites of marginal liquefaction. These scenarios qualitatively consider the effects of post-earthquake density change and subsequent aging on liquefaction resistance via penetration test results. To make these assessments, we consider how the measured penetration resistance corresponds to the penetration resistance that existed shortly (i.e., a couple of months to a couple of years) after the causative earthquake. This time period is consistent with the original development of the capacity curves, and thus the penetration resistance representative of this time period should be used for back-analysis. Because our proposed techniques are rather elaborate to describe, Figure 10 presents the techniques in flow chart form. In the following discussion and in Figure 10, we generically use (N1)60 or simply N1 to represent any overburden-normalized penetration resistance or in-situ test value. We also refer to pga and seismic demand interchangeably below. While seismic demand actually encompasses both pga and M and the following back-calculations provide values of both pga and M, a better assessment of M should be made by integrating the back-calculations from individual sites into a regional assessment.
Note that for all cases above, an estimate of pga (max possible) can be obtained.
Still, for purposes of back-calculation, sites of "no liquefaction" can be identified as sites having potentially liquefiable sandy sediments (i.e., below the watertable, Holocene age, relatively low penetration resistance, etc.) but lacking visible liquefaction features or evidence of liquefaction (i.e., sand boils, ground cracking, settlement, tilted buildings, etc.). Sites of no liquefaction defined as such will provide a reasonable upper limit of the magnitude (i.e., duration of demand). At sites of marginal and severe liquefaction where multiple in-situ tests are performed, it is possible to make a reasonable estimate of the lower limit of the strength of shaking (i.e., amplitude of demand) at a site using a representative value of penetration resistance selected using the guidelines in Table 1.
Appropriate site selection for performing back-calculations using observations in plan view also depends on the ground failure mechanism. For liquefaction resulting from hydraulic fracturing, the optimal sites are where the cap is relatively thin (i.e., preferably no more than a meter or two in thickness), and the watertable at the time of the earthquake was located within or at the base of the cap.
Whereas the thickness of the fine-grained cap and depth of the watertable can influence surface manifestations at sites of hydraulic fracturing, cap thickness has little or no influence on development of lateral spreading (Ishihara, 1985; Youd and Garris, 1995). Still, the use of lateral spreading features suffers from the fact that lateral spreading may not develop at higher values of (N1)60, even where there has been relatively strong shaking. Thus, the best sites for using lateral spreading features are beyond the meizoseismal zone, especially for very strong earthquakes.
For surface oscillations, it appears that the cap thickness does not have a major bearing on development of liquefaction features at the surface (Obermeier et al., 2001), but this may not always be the case. We suspect that the role of surface oscillations in development of surface manifestations is largely that of fracturing the cap, thereby providing a conduit for venting to the surface. Regardless of the actual role, where this mechanism has been operative, back-calculations using sites of marginal liquefaction associated with surface oscillations that adjoin sites of no liquefaction effects are valid.
Additional recommendations for site selection and interpretation using plan view observations are as follows.
Besides allowing investigators to identify potentially anomalous back-calculation results, performing a regional assessment can be used to qualitatively evaluate the effects of post-earthquake density change and aging. For studies using observations in either sectional or plan views, in-situ testing can be performed at many sites, regionally, where the ages of the source sands vary greatly from the age of the paleoearthquake, with some source sands being only slightly older (i.e., a few hundred years older) and some being considerably older. If the regional attenuation of pga beyond the meizoseismal zone forms a smooth plot, then aging is probably not an important contributor to the values of (N1)60(min, marg liq) used for back-calculations. Such an approach was used, de facto, by Pond (1996) in his study of the Wabash Valley earthquakes. A major problem with such an approach is that there may be a huge expenditure of time and money before the effects of changes in density and aging become clear. And, even in the final analysis, it will probably be difficult to assess which sites are most trustworthy.
Because of uncertainties involving the cyclic stress and the Green-Mitchell energy-based liquefaction evaluation procedures and the need for local calibration of the magnitude-bound method, paleoseismic interpretations have been based on using multiple, independent methods in some studies. We strongly advocate this approach wherever possible. Where the different methods yield the same results there can be very good confidence in interpretations of the strength of shaking, at least in terms of hazard assessment. Unfortunately the number of field settings where completely independent assessments can be made is quite limited, at least in the United States, because of the short historic record of only a few hundred years.
As a result, the need exists to reduce uncertainties in every phase of paleoliquefaction studies. Our proposed procedures and recommendations can potentially reduce uncertainties in site selection, field data collection, and the back-analysis itself (i.e., using both the cyclic stress and the Green-Mitchell energy-based methods). Furthermore, our proposed techniques allow, at least in a qualitative sense, different uncertainties to be examined for their relevance to the particular study. In a companion paper, Green et al. (in prep.) further describe the proposed back-analysis approach and provide examples of its application.
Andrus, R.D. and Stokoe, K.H., II, 1997, Liquefaction resistance based on shear wave Velocity: Proc. of the NCEER Workshop on Evaluation of Liquefaction Resistance of Soils, T.L. Youd and I.M. Idriss, eds., Technical Report NCEER-97-0022, State Univ. of New York at Buffalo, New York, p. 89-128.
Bartlett, S.F., and Youd, T.L., 1992, Empirical analysis of horizontal ground displacement generated by liquefaction-induced lateral spread: Technical Report No. NCEER-92-0021, State Univ. of New York at Buffalo, New York, 114 p.
Bjerrum, L., 1973, Geotechnical problems involved in foundations of structures in the North Sea: Geotechnique, v. 23, no. 3, p. 319-358.
Boulanger, R.W., Mejia, L.H., and Idriss, I.M., 1997, Liquefaction at Moss Landing during Loma Prieta earthquake: J. of Geotechnical and Geoenvironmental Engineering, ASCE, v. 123, no. 5, p. 453-467.
Carter, D.P., and Seed, H.B., 1988, Liquefaction potential of sand deposits under low levels of excitation: Report No. UCB/EERC-88/11, Earthquake Engineering Research Center, Univ. of California, Berkeley, 119 p.
Dobry, R., Ladd, R.S., Yokel, F.Y., Chung, R.M., and Powell, D., 1982, Prediction of pore water pressure buildup and liquefaction of sands during earthquakes by the cyclic strain method: NBS Building Science Series 138, U.S. Dept. of Commerce, 152 p.
Dowding, C.H., and Hyrciw, R.D., 1986, A laboratory study of blast densification of saturated sands: J. of Geotechnical Engineering, ASCE, v. 112, no. 2, p. 187-199.
Ellis, C., and de Alba, P., 1999, Acceleration distribution and epicentral location of the 1755 "Cape Ann' earthquake from case histories of ground failure: Seismological Research Letters, v. 70, no. 6, p. 758-773.
Fear, C.E., and McRoberts, E.C., 1995, Reconsideration of initiation of liquefaction in sandy soils: J. of Geotechnical Engineering, ASCE, v. 121, no. 3, p. 249-261.
Finn, W.D.L., 2002, State of the art for the evaluation of seismic liquefaction potential: Computers and Geotechnics, v. 29, p. 329-341.
Finn, W.D.L., Bransby, P.L., and Pickering, D.J., 1970. Effect of strain history on liquefaction of sands: J. of the Soil Mechanics and Foundations Division, ASCE, v. 96, no. SM6, p. 1917-1934.
Frankel, A.D., Petersen, M.D., Mueller, C.S., Haller, K.M., Wheeler, R.L., Leyendecker, E.V., Wesson, R.L., Harmsen, S.C., Cramer, C.H., Perkins, D.M., and Rukstales, K.S., 2002, Documentation for the 2002 update of the national seismic hazard maps: U.S. Geological Survey Open-File Report 02-420.
Galli, P., 2000, Empirical relationships between magnitude and distance for liquefaction: Tectonophysics, v. 324, p. 169-187.
Green, R.A., 2001, Energy-based evaluation and remediation of liquefiable soils: Ph.D. Thesis, Civil Engineering Dept., Virginia Tech, Blacksburg, Virginia, 397 p. (http://scholar.lib.vt.edu/theses/available/etd-08132001-170900/)
Green, RA., and Mitchell, J.K., 2003, A closer look at Arias intensity-based liquefaction evaluation procedures: Proc., 7th Pacific Conference on Earthquake Engineering, Univ. of Canterbury, Christchurch, New Zealand, Feb. 13-15.
Green, R.A., Obermeier, S.F., and Olson, S.M., in prep., 2003, Geotechnical analysis of paleoseismic shaking using liquefaction features: Part II. Field examples.
Hurst, A., and Cronin, B.T., 2001, The origin of consolidation laminae and dish structures in some deep-water sandstones: J. of Sedimentary Research, v. 71, no. 1, p. 136-143.
Hwang, J.H., 1993, Evaluation of simplified method for liquefaction analysis: Report to Provisional Office of High Speed Rail, Taiwan. Cited in Hwang et al., 1995.
Hwang, J.H., Chang, C.T., and Chen, C.H., 1995, Study on stress reduction factor rd for liquefaction analysis: Proc., 1st International Conf. on Earthquake Geotechnical Engineering, Tokyo, Japan, v. 1, p. 617-622.
Idriss, I.M., and Seed, H.B., 1968, An analysis of ground motions during the 1957 San Francisco earthquake: Bull. of the Seismological Society of America, v. 58, no. 6, p. 2013-2032.
Ishibashi, I., and Zhang, X., 1993, Unified dynamic shear moduli and damping ratios of sand and clay: Soils and Foundations, v. 33, no. 1, p. 182-191.
Ishihara, K., 1985, Stability of natural deposits during earthquakes: Proc., 11th International Conf. on Soil Mechanics and Foundation Engineering, San Francisco, California, v. 1, p. 321-376.
Iwasaki, T., Tatsuoka, F., and Yasuda, S., 1978, A practical method for assessing soil liquefaction potential based on case studies at various sites in Japan: Proc., 2nd International. Conf. on Microzonation for Safer Construction and Research Applications, San Franscisco, v. 2, p. 885-896.
Keefer, D.K., 1984, Landslides caused by earthquakes, Geological Society of America Bull., v. 95, p. 406-421.
Kuribayashi, E., 1985, Private communication with N.N. Ambraseys on 7/27/85, regarding updating of relations in Kuribayashi and Tatsuoka (1975). Cited in Ambraseys (1988).
Kuribayashi, E., and Tatsuoka, F., 1975, Brief review of liquefaction during earthquakes in Japan: Soils and Foundations, v. 15, no. 4, p. 81-92.
Law, K.T., Cao, Y.L., and He, G.N., 1990, An energy approach for assessing seismic liquefaction potential: Canadian Geotechnical Journal, v. 27, no. 3, p. 320-329.
Lee, K.L., and Focht, J.A., 1975, Liquefaction potential of Ekofisk Tank in North Sea: J. of the Geotechnical Engineering Division, ASCE, v. 100, no. GT1, p. 1-18.
Lodge El-Telbany, A., Rector, J.W., Mitchell, J.K., and Seed, R.B., 1996, The accuracy of shear wave velocity measurements taken using the seismic cone penetrometer: Proceedings, Symposium on the Application of Geophysics to Engineering and Environmental Problems, Environmental and Engineering Geophysical Society, Keystone, Colorado, p. 159-169.
Lunne, T., Robertson, P.K., and Powell, J.J.M., 1997, Cone Penetration Testing in Geotechnical Practice, Blackie Academic & Professional, 312 p.
Martin. J. R., and Clough, G.W., 1994, Seismic parameters from liquefaction evidence: J. of Geotechnical Engineering, ASCE, v. 27, no. 8, p. 1345-1361.
Maugeri, M., Carrubba, P., and Frenna, S.M., 1989, Seismic induced shear stress for liquefaction analysis: Proc., 4th Inter. Conf. on Soil Dynamics and Earthquake Engineering, Southampton, England, v. 1, p. 1-20.
Mesri, G., Feng, T.W., and Benak, J.M., 1990. Postdensification penetration resistance of clean sands: J. of Geotechnical Engineering, ASCE, v. 116, no. 7, p. 1095-1115.
Mesri, G., and Godlewski, P.M., 1977, Time- and stress-compressibility interrelationship: J.of Geotechnical Engineering, ASCE, v. 103, no. 5, p. 417-430.
Munson, P.J., and Munson, C.A., 1996, Paleoliquefaction evidence for recurrent strong earthquakes since 20,000 yr BP in the Wabash Valley of Indiana: Final Report, submitted to the U.S. Geological Survey; Anthropology Dept., Indiana University, Bloomington, March, 1996, 137 p.
Nishiyama, H., Yahagi, K., Nakagawa, S., and Wada, K., 1977, Practical method of predicting sand liquefaction: Proc., 9th Inter. Conf. on Soil Mechanics and Foundation Engineering, Tokyo, Japan, v. 2, p. 305-308.
NRC (National Research Council), 1985, Liquefaction of soils during earthquakes: Committee on Earthquake Engineering, Commission on Engineering and Technical Systems, National Research Council, National Academy Press, Washington, D.C., 240 p.
Obermeier, S.F., 1993, Paleoliquefaction features as indicators of potential earthquake activity in the southeastern and central United States: Highway Research Board Record No. 1141, Highway Research Board, Washington, D.C., p. 42-52.
Obermeier, S.F., 1996, Use of liquefaction-induced features for paleoseismic analysis -- An overview of how seismic liquefaction features can be distinguished from other features and how their regional distribution and properties can be used to infer the location and strength of Holocene paleo-earthquakes: Engineering Geology, Elsevier Science, v. 44, p. 1-76.
Obermeier, S.F., 1998, Liquefaction evidence for strong earthquakes of Holocene and latest Pleistocene ages in the states of Indiana and Illinois, USA: Engineering Geology, Elsevier Science, v. 50, p. 227-254.
Obermeier, S.F., and Dickenson, S.E., 2000, Liquefaction evidence for the strength of ground motions resulting from late Holocene Cascadia subduction earthquakes, with emphasis on the event of 1700 AD: Bull. of Seismological Society of America, v. 90, no. 4, p. 876-896.
Obermeier, S.F., Martin, J.R., Frankel, A.D, Youd, T.L., Munson, P.J., Munson, C.A., and Pond, E.C., 1993, Liquefaction evidence for one or more strong Holocene earthquakes in the Wabash Valley of southern Indiana and Illinois: U.S. Geological Survey Professional Paper 1536, 27 p.
Obermeier, S.F., Pond, E.C., and Olson, S.M., 2001, Paleoliquefaction studies in continental settings - geologic and geotechnical factors in interpretations and back-analysis: U.S. Geological Survey Open-File Report 01-029, 75 p. (http://pubs.usgs.gov/openfile/of01-029/)
Oda, M., Kawamoto, K., Suzuki, K., Fujimori, H., and Sato, M., 2001, Microstructural interpretation on reliquefaction of saturated granular soils under cyclic loading: J. of Geotechnical and Geoenvironmental Engineering, ASCE, v. 127, no. 5, p. 416-423.
Olson, S.M., Obermeier, S.F., and Stark, T.D., 2001, Interpretation of penetration resistance for back-analysis at sites of previous liquefaction: Seismological Research Letters, v. 72, no. 1, p. 46-59.
Olson, S.M., and Stark, T.D., 1998, CPT based liquefaction resistance of sandy soils: Proc., Specialty Conf. On Geotechnical Earthquake Engineering and Soil Dynamics III, v. 1, ASCE, Aug. 3-6, Seattle, Washington, p. 325-336.
Owen, W.P., and Roblee, C.J., 2000, Borehole velocity logging for Caltrans' earthquake engineering program: comparison of field measurements: Proc., 1st Intl. Conf. on the Application of Geophysical Methodologies & NDT to Transportation Facilities and Infrastructure, Geophysics 2000, Federal Highway Administration and Missouri Dept. of Transportation, Dec. 11-15, St. Louis, Missouri, p. 1.5.1 - 1.5.13.
Papadopoulos, G.A., and Lefkopoulos, G., 1993, Magnitude-distance relations for liquefaction in soil from earthquakes: Bull. of the Seismological Society of America, v. 83, no. 3, p. 925-938.
Pond, E.C., 1996, Seismic parameters for the central United States based on paleoliquefaction evidence in the Wabash Valley: PhD Thesis, Virginia Tech, Civil Engineering Dept., Blacksburg, Virginia, 583 p.
Pond, E.C., and Martin, J.R., II, 1996, Seismic parameters for the central United States based on paleoliquefaction evidence in the Wabash Valley: Final Report, submitted to the U.S. Geological Survey; Civil Engineering Dept., Virginia Tech, Blacksburg, Virginia, August, 1996, 583 p.
Robertson, P.K., and Wride, C.E., 1997, Cyclic liquefaction and its evaluation based on the SPT and CPT: Proc. of the 1996 NCEER Workshop on Evaluation of Liquefaction Resistance of Soils, T.L. Youd and I.M. Idriss, eds., Technical Report NCEER- 97-0022, State University of New York at Buffalo, New York, p. 41-87.
Schmertmann, J.H., 1991, The mechanical aging of soils: J. of Geotechnical Engineering, ASCE, v. 117, no.9, p. 1288-1330.
Schneider, J., 1999, Liquefaction response of soils in mid-America evaluated by seismic cone tests: M.S. Thesis, School of Civil and Environmental Engineering, Georgia Institute of Technology, Atlanta, 273 p.
Seed, H.B., Arango, I., and Chan, C.K., 1975, Evaluation of soil liquefaction potential during earthquakes: Report No. EERC 75-28, Earthquake Engineering Research Center, University of California, Berkeley, California, 113 p.
Seed, H.B., and Idriss, I.M., 1971, Simplified procedure for evaluating liquefaction potential: J. of the Soil Mechanics and Foundations Div., ASCE, v. 97, p. 1249-1273.
Seed, H.B. and Idriss, I.M., 1982, Ground motions and soil liquefaction during earthquakes: Monograph Series, Earthquake Engineering Research Institute, Oakland, California, 134 p.
Seed, H.B., Mori, K., and Chan, C.K., 1977, Influence of seismic history on liquefaction of sands: J. of the Geotechnical Engineering Division, ASCE, v. 102, no. GT4, p. 246-270.
Seed, H.B., Tokimatsu, K., Harder, L.F., and Chung, R.L., 1985, Influence of SPT procedures in soil liquefaction resistance evaluations: J. of Geotechnical Engineering, ASCE, v. 111, no. 12, p. 1425-1445.
Seed, H.B., Wong, R.T., Idriss, I.M., and Tokimatsu, K., 1986, Moduli and damping factors for dynamic analysis of cohesionless soils: J. of Geotechnical Engineering, ASCE, v. 112, no. GT11, p. 1016-1032.
Seed, R.B., Dickenson, S.E., Reimer, M.F., Bray, J.D., Sitar, N. Mitchell, J.K., Idriss, I.M., Kayen, R.E., Kropp, A., Harder, L.F., and Power, M.S., 1990, Preliminary report on the principal geotechnical aspects of the October 17, 1989 Loma Prieta earthquake: Report UCB/EERC-90/05, Earthquake Engineering Research Center, University of California, Berkeley, 137 p.
Solymar, Z.V., 1984, Compaction of alluvial sands by deep blasting: Canadian Geotechnical Journal, v. 21, no. 2, p. 305-321.
Stark, T.D., and Olson, S.M., 1995, Liquefaction resistance using CPT and field case histories: J. of Geotechnical Engineering, ASCE, v. 121, no. 12, p. 856-869.
Stone, W.C., Yokel, F.Y., Celebi, M., Hanks, T., and Leyendecker, E.V., 1987, Engineering aspects of the September 19, 1985 Mexico earthquake: NBS Building Science Series 165, National Bureau of Standards, Washington, D.C., 207 p.
Talwani, P., and Schaeffer, W.T., 2001, Recurrence rates of large earthquakes in the South Carolina Coastal Plain based on paleoliquefaction data: J. of Geophysical Research, v. 106, no. B4, p. 6621-6642.
Terzaghi, K., Peck, R.B., and Mesri, G., 1996, Soil Mechanics in Engineering Practice: Third Edition: John Wiley & Sons, Inc., New York, 549 p.
Tuttle, M.P., 1999, Late Holocene earthquakes and their implications for earthquake potential of the New Madrid Seismic Zone, central United States: Ph.D. Thesis, Department of Geology, University of Maryland, College Park, 250 p.
Vaid, Y.P., Chung, E.K.F., and Kuerbis, R.H., 1989, Preshearing and undrained response of sand: Soils and Foundations, v. 29, no. 4, p. 49-61.
Vreugdenhil, R., Davis, R., and Berrill, J., 1994, Interpretation of cone penetration results in multilayered soils: International Journal for Numerical Methods in Geomechanics, v. 18, p. 585-599.
Whitman, R.V., 1971, Resistance of soil to liquefaction and settlement: Soils and Foundations, v. 11, no 4, p. 59-68.
Youd, T.L., and Garris, C.T., 1995. Liquefaction-induced ground-surface disruption: J. of Geotechnical Engineering, ASCE, v. 121, no. 11, p. 805-809.
Youd, T.L., and Idriss, I.M., eds., 1997, Proc. of the NCEER Workshop on Evaluation of Liquefaction Resistance of Soils: Technical Report NCEER-97-0022, State University of New York at Buffalo, New York, 276 p.
Youd, T.L., and Noble, S.K., 1997, Liquefaction criteria based on statistical and probabilistic analysis: Proc. of the NCEER Workshop on Evaluation of Liquefaction Resistance of Soils, T.L. Youd and I.M. Idriss, eds., Technical Report NCEER 97-0022, State University of New York at Buffalo, New York, p. 210-216.
Youd, T.L., and Perkins, D.M., 1978, Mapping liquefaction-induced ground failure potential: J. of Geotechnical Engineering Division, ASCE, v. 104, no. GT4, p. 433-446.
Youd, T.L., Idriss, I.M., Andrus, R.D., Arango, I., Castro, G., Christian, J.T., Dobry, R., Finn, W.D.L., Harder, L.F., Hynes, M.E., Ishihara, K., Koester, J.P., Liao, S.S.C., Marcuson, W.F., Martin, G.R., Mitchell, J.K., Moriwaki, Y., Power, M.S., Robertson, P.K., Seed, R.B., and Stokoe, K.H., 2001, Liquefaction resistance of soils - Summary report from the 1996 NCEER and 1998 NCEER/NSF workshops on evaluation of liquefaction resistance of soils: J. of Geotechnical and Geoenvironmental Engineering, ASCE, v. 127, no. 4, p. 297-313.