
USGS Open-File Report 03-372, Topography, shaded relief, and backscatter intensity of the Hudson Shelf Valley, offshore of New York
Abstract
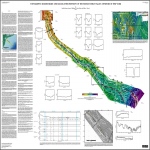
The 150-km-long Hudson Shelf Valley, the largest physiographic feature on the mid-Atlantic continental shelf, bisects the New York Bight region. The Valley is the submerged seaward extension of the ancestral Hudson River drainage system that, unlike other valleys on the Atlantic shelf, has not been filled with sediment. A survey of the topography and backscatter intensity of the valley has been carried out using a Simrad Subsea EM 1000 multibeam sea floor mapping system. The valley head is located in a broad shallow basin and extends offshore 5-40 m below the shelf surface to a seaward terminus at a shelf-edge delta. The valley can be divided into upper, middle, lower and outer sections based on the topography, surficial sediments, and drainage pattern. The middle valley is characterized by 5 local topographic lows along the valley axis that have relief of 3-11 m below the valley floor. The northwestern portion of the study area has been affected by disposal of dredged and other materials since the late 1800's. Part of this area has been designated as the Historic Area Remediation Site (HARS). The sea floor of the HARS is being remediated by placing at least a one-meter cap of clean dredged material on top of the existing surface sediments that exhibit varying degrees of degradation. A large field of sand waves is located in the lower valley in 70-80 m water depth that cover an area approximately 30 km long and 4 km wide. This sand wave field is hypothesized to be part of a flood deposit that formed as a result of the break-out of glacial lakes in upstate New York approximately 13,500 years BP. In the eastern-most part of the survey area in water depths greater than about 110 m, the sea floor is marked by long narrow northeast-southwest-trending grooves that are interpreted to be iceberg scour marks.
Introduction
This report shows the sea floor topography, shaded relief, and backscatter intensity of the Hudson Shelf Valley (figure 1) at a scale of 1:150,000 based on multibeam echo-sounder data. The multibeam surveys were conducted aboard the vessel Frederick G. Creed, a SWATH (Small Waterplane Area Twin Hull) vessel in fall 1996, 1998, and spring 2000. A Simrad Subsea EM 1000 Multibeam Echo Sounder (95 kHz) was used to acquire these data. This multibeam system utilizes 60 electronically aimed beams spaced at intervals of 2.5° that insonify a strip of sea floor up to 7.5 times the water depth (swath width of 100 to 400 m within the survey area). The horizontal resolution of the beam on the sea floor is approximately 10% of the water depth (3-50 m in the survey region). Vertical resolution is approximately 1 percent of the water depth (.3 to 5 m). The bathymetric soundings were corrected for tidal elevation using tides predicted from the ADCIRC model (Westerink and others, 1994) and are shown relative to mean sea level. The multibeam bathymetric soundings and backscatter intensity are presented in these maps at 30 m/pixel resolution.
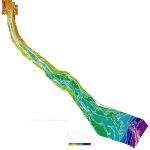
The shaded relief image (sheet 1, figure 2 (with additional information), and sheet 2, Map A), colored according to water depth, was created by vertically exaggerating the topography four times and then artificially illuminating the relief by a light source positioned 45 degrees above the horizon from the north. In the resulting image, topographic features are enhanced by strong illumination on the northward-facing slopes and by shadows cast on southern slopes. The shaded relief image accentuates small features that could not be effectively shown as contours alone at this scale. The water depth, using a color scale from red (shallow) to violet (deep), is superimposed.
Smoothed bathymetric contours were created using ARCGIS geographic information system software (Environmental Systems Research Institute, Inc. (ESRI), version 8.2). Smoothing of the multibeam data over 150 m was accomplished using a median filter (5-cell by 5-cell area for the 30m/pixel multibeam data) with the "focalmedian" routine. Topographic contours at 5 m intervals from 20-100 m, and at 50 m intervals from 100-500 m were generated from the grid using the "latticecontour" routine. Topographic lows are identified by hachured contours (hachures face deeper water).
The location of the thalweg (deepest portion) of the Hudson Shelf Valley (sheet 1, figure 2) was determined using the contoured bathymetry and a streamflow network as guides. The streamflow network was computed using the ESRI Hydro toolbox. Networks that drain areas larger than 2.25 square km (2500 pixels) are shown. The stream pattern was forced to flow through the enclosed basins along the deepest depths by creating holes at the bottom of each basin. Networks that drain areas larger than 2.25 square km (2500 pixels) are shown. Along-track depressions of order 50 cm in the bathymetry at the outer edge of the survey tracks often captured the streamflow in areas of flat topography (for example, see the outer portion of the Hudson Shelf Valley) and resulted in unrealistic straight runs in the streamflow path. The water depth along the thalweg is shown in figure 3a.
Surface sediment samples in Hudson Shelf Valley and vicinity were obtained on various cruises between 1993 and 2000 using a modified Van Veen grab or a hydrostatically damped corer designed to collect undisturbed sediment samples. Sediment texture of the surface sediment (typically the upper 2 cm) was determined using the methods described in Poppe and others (2000). Sediment samples taken along or near the axis of the Valley were assigned an along-valley position (figure 2) and used to examine the down-valley changes in sediment texture (figure 3b, c, d, and e). Data from four of these cruises and selected bottom photographs may be found in Butman and others (2003).
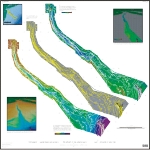
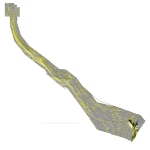
Map A (sheet 2) shows topography as shaded relief, depth coded by color, and topographic contours at 5 m intervals to 100m and 50 m intervals from 100-500 m (this is the same image as sheet 1, figure 2 but without the stream network and sediment stations). Map B (sheet 2) shows topography as shaded relief and topographic contours. Map C (sheet 2) shows sea floor topography as shaded relief, backscatter intensity coded by color and topographic contours. The backscatter intensity is represented by a suite of eight colors ranging from blue, which represents low intensity, to red, which represents high intensity. Backscatter intensity is a measure of surficial sediment texture and bottom roughness. Generally, high backscatter intensity is associated with rock or coarse-grained sediment, and low backscatter intensity characterizes finer grained sediments. Direct observations, using bottom photography or video and sampling techniques such as grab sampling or coring, are needed to verify interpretations of the backscatter intensity.
Some features in the multibeam data are artifacts of data collection and environmental conditions. They include small highs and lows and unnatural looking features or patterns oriented parallel or perpendicular to survey track lines. Throughout the survey area small (50 cm or less) linear depressions and ridges run parallel to the survey track lines (the track line orientation is identified by the faint parallel stripes in the images). For example, see the area along the western edge of the valley centered near 40°04' N., 73° 33.5' W., in the central part of the lower valley near 39°52' N., 73°5.4' W., and on the outer shelf near 39°41.5' N., 72°28.0' W. where the track lines run northwest-southeast (sheet 2, Map B). These features are caused by uncorrected refraction of the multibeam observations in the outer beams; additional editing may remove these artifacts. Some of the small-scale roughness in cross-valley (figure 2) and along-valley depth profiles is caused by these artifacts.
Sea floor topography from the National Oceanic and Atmospheric Administration Coastal Relief Model (National Geophysical Data Center) is used to provide bathymetry outside the area surveyed using multibeam (figure 1, figure 6, and figure 7). These data are a compilation of available bathymetric observations at a horizontal resolution of 90 m/pixel.
Geologic Background
The 150-km-long Hudson Shelf Valley, the largest physiographic feature on the mid-Atlantic continental shelf, bisects the New York Bight region (sheet 1 figure 1, and sheet 2, figure 6 and figure 7). The Valley is the submerged seaward extension of the ancestral Hudson River drainage system that, unlike other valleys on the Atlantic shelf, has not been filled with sediment. The valley head is located in a broad shallow basin (Christiansen Basin) and extends offshore 5-40 m below the shelf surface to a seaward terminus at a shelf-edge delta (Ewing and others, 1963; Emery and Uchupi, 1972; Uchupi and others, 2001).
The ancestral Hudson River is hypothesized to have begun to develop in the Late Cretaceous when post-Atlantic rifting caused continued uplift and tilting of the margin, resulting in landward erosion and marginal seaward growth that continued into the Tertiary (Weiss, 1974). The Hudson Shelf Valley is thought to have been repeatedly downcut during periods of Pleistocene marine regression (Suter and others, 1949; Weiss, 1974). This downcutting possibly was amplified by the proposed catastrophic drainage of late Wisconsinan glacial lakes 12,000 - 14,000 yr BP (Newman and others, 1969; Uchupi and others, 2001). At this time, the shoreline was located approximately at the 60 m isobath (Thieler and others, 1999). At 12,000 - 14,000 yr BP, the large glacial lakes north of the New York Bight are thought to have breached the moraine front at the Verrazano Narrows and other locations in New Jersey and New York (Newman and others, 1969; Soren, 1971; Lovegreen, 1974). Boring data at the Verrazano Narrows indicate that more than 100 m of Pleistocene and Cretaceous sedimentary material was eroded as a result of this breaching event(s), along with most of the lacustrine sediment deposited during the previous 8,000 yr (Newman and others, 1969). Uchupi and others (2001) propose that late Wisconsin erosion of the Hudson Shelf Valley and deposition of sediment lobes (figure 1) on the outer shelf were a consequence of this catastrophic drainage.
The surficial geology and sediments of the northern portion of the survey area and the surrounding region are described in Butman and others (1998), Schwab and others (1997a, 1997b, 2000). The multibeam data in the Historic Area Remediation Site (HARS) is described in Butman and others (2002) and Butman (2003).
Features
This report presents a description of features of the Hudson Shelf Valley system visible at a scale of 1:150,000.
Valley topography and morphology
The Hudson Shelf Valley originates in the Christiansen Basin at a water depth of about 30 m and terminates about 150 km to the southwest near the head of the Hudson Canyon at about 85 m water depth. The valley is divided into upper, middle, lower and outer sections based on the topography, surficial sediments, and drainage pattern (figure 2, figure 3).
The upper valley begins at about 30 m water depth in the Christiansen Basin and terminates at about 65 m water depth at the beginning of a series of semi-enclosed basins in the valley axis (figure 3a). This upper part of the valley is 25 km long, trends nearly north-south and the water depth deepens nearly linearly with a slope of 1.35 x 10⁻³ or about 0.08°. There are two drainage pathways from the shelf into the upper portion of the valley (figure 2). The first pathway drains the Christiansen Basin and areas to the east of anthropogenic disposal sites (see below), running to the east of a low ridge near 40°22.5' N., 73°47.15' W. at about 38 m water depth and then turning southwest to join the major axis of the valley near at a water depth of about 43 m near 40°22.37' N., 73°47.8' W. The second pathway drains an area to the west, south and southwest of the anthropogenic disposal sites. This second pathway has two tributaries, one which extends northward along a small valley near 40°22.3' N., 73°49.0' W., and one that extends westward to a point near 40°22.2' N., 73°51' W. There is a fork in the valley near 40°17.6' N., 70°47.3' W. at about 58 m water depth (see figure 2c); the main axis of the valley follows the eastern fork.
Along the axis of the upper valley the sediment texture becomes increasingly finer, from a mean grain size of about 4 phi at 30 m in the Christiansen Basin (about 70% sand and 30% fines (silt plus clay)) to a mean of about 6.5 phi at 60 m (about 20% sand and 80% fines) (3b, c). Throughout the upper valley, the sand is predominantly very fine sand (figure 3e). The finest sediments along the axis valley are found at the transition between the upper and middle valley (between 40°16.9' N., 73°47.2' W. (just down-valley from the fork) and 40°13.5' N., 73°36.0' W. (just up-valley from the center of the first topographic low (see below)).
The mid-valley begins at about 65 m and ends at nearly the same depth near 39°55' N., 73°09' W. (figure 2, figure 3). At the beginning of the middle valley the orientation of the axis changes from north-south to southeastward. The mid-valley is about 5 km wide, has a well-defined cross-canyon v-shape (figure 2d), ranges from about 20 m (figure 2i) to 40 m (figure 2f) deeper than the adjacent shelf, is floored with low backscatter intensity material (Map 2C, sheet 2), and is characterized by 5 local topographic lows (basins) along the axis (figure 3a). The centers of these basins (figure 2 and figure 3a) are near (1) 40°2.3' N., 73°44.85' W. (deepest water depth 68 m, basin enclosed by the 64 m contour); (2) 40°7.2' N., 73°36.5' W. (deepest water depth 75 m, basin enclosed by the 72 m contour); (3) 40°3.95' N., 73°28.7' W. (deepest water depth 87 m, basin enclosed by the 76 m contour); (4) 39°57 N., 73°18.12' W. (deepest water depth 86 m, basin enclosed by the 75 m contour), and (5) 39°56.15' N., 73°10.39' W. (deepest water depth 84 m, basin enclosed by the 75 m contour). The relief of these basins from the axis floor is about 4, 3, 11, 11, and 9 m respectively, and the along-axis extent, defined by the distance between the up-valley and down-valley location of the closed contour surrounding the basin low, is approximately 12.0, 5.3, 11.7, 7, and 7.6 km. A shallow topographic low with relief of about 1 m is located near 40°0.7' N., 73°23.07' W. (water depth 77 m defined by the 76 m contour) just down-valley from basin 3.
The sediment texture in the mid valley is varied (figure 3b-e). In several cases, the texture data suggest finer sediments in the basins relative to the topographic highs that separate them. For example, the mean grain size at station 13 in basin 2 is finer that at station 15 on the down-valley topographic high, and the mean grain size at stations 20 and 22 in basins 4 and 5 respectively is finer than at station 21 on the intervening high. In contrast in basin 1 (stations 9 and 10) the sediments are almost the coarsest in the mid-valley. The one coarse sample in basin 3 (station 17) is located within 250 m of the eastern wall of the canyon.
The lower valley begins at about 70 m water depth and ends at a series of local topographic highs (along a line from about 39°43.9' N., 72°40.75' W. to about 39°36.25' N., 72°36.1' W.) that divert the stream network drainage pattern of the Hudson Shelf Valley toward the southeast, away from the head of Hudson Canyon that indents the shelf break near 39°40.6' N., 70°29.5' W (figure 2). The crests of these topographic highs range from about 64 m in the north, to about 73 m in the south (figure 2p). Landward of this line, the stream network drains to the southeast, terminating on the shelf at 80 m water depth near 39°34.8' N.and 72°35.3' W. Seaward of this line, the streamflow network drains into the head of the Hudson Canyon. As noted previously (Emery and Uchupi, 1972), the present day Hudson Shelf Valley does not connect directly with the head of the Hudson Canyon that indents the continental shelf.
The lower valley is 10 km or more wide, has a poorly defined axis that is 15 (figure 2o)-25 m (figure 2m) deeper than the adjacent shelf, and the floor is covered with moderate backscatter intensity material (sheet 2, Map C). The average slope of the outer valley floor is 0.17x10⁻³, or about 0.01°. A field of 1-5 m high sand waves occurs in the lower valley (see below). There are two topographic lows in the lower valley. One low along the southwest side of the valley is centered near 39°46.8' N., 72°55.2' W. (deepest water depth 89 m, basin enclosed by the 76m contour) and contains a series of circular depressions 4-5 m deep and a few hundred meters across. The second low is centered near 39°51.65' N., 73°2.4' W. (deepest water depth 77 m, basin enclosed by the 74 m isobath). The sediments in the lower valley are typically greater than 70% sand (figure 3c) (typically less than 15% very fine sand, figure 3e)) and the mean grain size is about 3.0 phi (figure 3b). The texture is less variable than in the upper and mid-valley sections.
The outer shelf extends eastward from the series of topographic highs that define the seaward extent of the lower valley and ends at the head of the Hudson Canyon. There are several paths, deeper to the southeast, through the topographic highs. On the outer shelf, several of the drainage pathways are captured by the small topographic errors in the multibeam that run parallel to the survey tracklines. Further data editing is needed to remove these artifacts. The backscatter intensity is moderate and the sediments are sand.
Anthropogenic features
The survey area north of about 40°21' N. and west of 73°46' W. (see sheet 1 figure 4 and sheet 2 Maps A-C) has been affected by disposal of dredged and other materials since the late 1800's (Butman and others (1998), Butman and others (2002), Butman (2003)). Between 1976 and 1995, the New York Bight Dredged Material Disposal Site, also known as the Mud Dump Site (figure 4), received on average about 6 million cubic yards of material each year from maintenance dredging and from harbor deepening activities (Massa and others, 1996). In September 1997 the Mud Dump Site (MDS) was closed as an official ocean disposal site and the MDS and surrounding areas were designated as the Historic Area Remediation Site (HARS). The sea floor of the HARS, approximately 9 square nautical miles in area, is being remediated by placing at least a one-meter cap of clean dredged material on top of the existing surface sediments that exhibit varying degrees of degradation. Features of the sea floor shown in these images resulting from anthropogenic disposal include (see figure 4): (1) two relatively smooth topographic highs composed of material dumped in the late 1800's and early 1900's (centered near 40°25.5' N., 73°51.6' W. and 40°24' N., 73°51.75' W. and both about 16 m below the sea surface); (2) mounds of material in the Mud Dump Site (for example, see mounds centered near 40°22.7' N., 73°50.98' W., 40° 22.97', 73° 50.01' W., and 40°23.55' N., 73°50.08' W.); (3) two circular features where contaminated sediments were placed and then capped with sand, one in the late 1980's (centered near 40°22' N., 73°51' W.) and the other in 1997 (centered near 40°22.25' N., 73°50.45' W.); (4) many features about 50 m in diameter interpreted to be individual dumps of material (for example see the area north of 40°24.5' N. between 73°49' W. and 73°51' W. where the substrate is fine sand and mud and the features appear as high-backscatter intensity, many in linear groupings of 5 or more and are often aligned in a northwest-southeast direction); (5) and material placed as part of remediation activities (see low-backscatter circular feature centered near 40°24.75' N., 73°52.8' W., and high-backscatter crater-like features centered near 40°23.8' N., 73°53' W.).
Sand wave field
A large field of sand waves is located in the lower valley in 70-80 m water depth that cover an area approximately 30 km long and 4 km wide (sheet 1 figure 5, sheet 2 Map A, Map B, and Map C). In the center of the valley axis, for example near 39°52' N., 73°5.4' W. and 39°48.3' N., 73° 0 W., sand waves have crest directions orthogonal to the valley axis and extend up to 3 km across the valley. These features have a height of 0.5 to 1 m and wavelength of 200-300 m (figure 5a, b). On the western side of the valley, for example near 39°48.5' N., 73°1.4' W. and 39°46.8' N., 72°59.2' W., there are a series of bedforms that are about 4-8 m deep and about 300 m in diameter (figure 5c).
The sand wave field is hypothesized to be part of a flood deposit that formed as a result of the break-out of glacial lakes in upstate New York approximately 13,500 years BP. This catastrophic flood broke through the Verazano Narrows between Staten Island and Long Island, and partially drained what is now western Long Island Sound, the lower Hudson estuary, and Raritan Bay. Regional sea-level data, coupled with paleotopographic modeling (Peltier, 1994) suggest this portion of the mid-Atlantic Bight was subaerially exposed at about 13,000 - 14,000 years BP, likely placing the valley-floor sandwaves in a shallow, subaqueous (marine?) environment during the flood event. The preservation of these sandwaves may be attributed to their sequestration below the depth of active marine reworking by the rapid global sea-level rise over the next several thousand years beginning with melt-water-pulse (mwp) - 1A (Fairbanks, 1989). This was the most rapid sea-level rise event in the late Quaternary (about 6 m/m for several hundred years) and is hypothesized to have drowned the sandwaves before they could be extensively reworked or destroyed by shallow marine processes.
Iceberg scour marks
In the eastern-most part of the survey area (east of about 72°23' W.) in water depths greater than about 110 m, the sea floor is marked by long narrow grooves that have a dominant northeast-southwest orientation. The grooves are typically 100 m wide, a few meters deep, and 1-2 km in length. These grooves are similar to those observed offshore of Boston (Valentine and others, 2001) and are interpreted to be marks made by the bottoms of icebergs that gouged the seabed by grounding here during the late stages of the last glaciation.
Acknowledgments
The multibeam surveys were conducted with support from the Canadian Hydrographic Service and the from the University of New Brunswick. For their skillful work at sea, we thank the officers and crew of the Canadian Hydrographic Survey Vessel Frederick G. Creed. N. Doucet and J. Gagne of the Canadian Hydrographic Service led the acquisition of the multibeam data. W. Danforth led the multibeam data acquisition and processing. J. Hughes Clark of the University of New Brunswick Ocean Mapping Group provided the data acquisition and processing software and assisted in data collection and processing at sea. J. Denny, B. Gutierrez, L. Hayes, J. Malczyk, and T. O'Brien provided operational support at sea. M. Buchholtz ten Brink and E. Mecray provided some of the texture data. D. Newman did the CD-ROM layout and HTML.
Any use of trade or product names is for descriptive purposes only, and does not imply endorsement by the U.S. Government. This report is preliminary and has not been reviewed for conformity with U.S. Geological Survey editorial standards.
References
Butman, Bradford, 2003, Mapping the Sea Floor of the Historic Area Remediation Site Offshore of New York City: U.S. Geological Survey Fact Sheet, 001-02. (Also available online at http://pubs.usgs.gov/fs/fs001-02/.)
Butman, B., Danforth, W.W., Schwab, W.C., ten Brink, M.B., 1998, Multibeam Bathymetric and Backscatter Maps of the Upper Hudson Shelf Valley and Adjacent Shelf, Offshore of New York: U.S. Geological Survey Open File Report, 98-616, 4 sheets. (Also available online at http://pubs.usgs.gov/of/of98-616/.)
Butman, Bradford, Danforth, W.W., Knowles, S.C., May, B., Serrett, Laurie, 2002, Sea Floor Topography and Backscatter Intensity of the Historic Area Remediation Site (HARS), Offshore Of New York, Based on Multibeam Surveys Conducted in 1996, 1998, And 2000: U.S. Geological Survey Open File Report 00-503, 1 DVD-ROM. (Also available online at http://pubs.usgs.gov/of/of00-503/.)
Emery, K.O., and Uchupi, E., 1972, Western North Atlantic Ocean: Topography, rocks, structure, water, life, sediment: American Association of Petroleum Geologists, Memoir 17.
Ewing, J., LePichon, X., and Ewing, M., 1963, Upper stratification of Hudson Apron region: Journal of Geophysical Research, v. 68, p. 6303-6316.
Fairbanks, R.G., 1989, A 17,000-year glacio-eustatic sea level record: influence of glacial melting rates on the Younger Dryas event and deep-ocean circulation: Nature, 342, p. 637-642.
Lovegreen, J.R., 1974, Paleodrainage history of the Hudson Estuary: unpublished M.S. Thesis, Columbia University, 129 p.
Massa, A.A., Vicario, M. Del, Pabst, D., Pechko, P., Lechich, A., Stern, E.A., Dieterich, R., and May, B., 1996, Disposal of wastes and dredged sediments in the New York Bight: Northeastern Geology and Environmental Sciences, v. 18, no. 4, p. 265-285.
National Geophysical Data Center, [1998], NGDC Coastal Relief Model, Volume 01, U.S. North East Atlantic Coast: [no place] National Oceanic and Atmospheric Administration, version 1.0, 1 CD-ROM. (For further information online go to http://www.ngdc.noaa.gov/mgg/coastal.)
Newman, W.S., Thurber, D.L., Zwiss, H.S., Rokach, A., and Musich, L., 1969, Late Quaternary geology of the Hudson River estuary: a preliminary report: New York Academy of Sciences Transactions, Serial 2, v. 31, p. 548-570.
Peltier, W.R., 1994, Ice age paleotopography: Science, 265, p. 195-201.
Poppe, L.J., Eliason, A.H., Fredericks, J.J., Rendigs, R.R., Blackwood, D. and Polloni, C.F., Grain-size analysis of marine sediments - methodology and data processing, Chapter 1 in Poppe, L.J. and Polloni, C.F. (eds), 2000, USGS East-Coast Sediment Analysis: Procedures, Database and Georeferenced Displays: U.S. Geological Survey Open-file Report 00-358, 1 DVD-ROM. (Also available online at http://pubs.usgs.gov/of/2000/of00-358/.)
Schwab, W.C., Allison, M.A., Corso, W., Lotto, L.L., Butman, B., Buchholtz ten Brink, M., Denny, J.F., Danforth, W.W., and Foster, D.S., 1997a, Initial results of high-resolution sea-floor mapping offshore of the New York-New Jersey metropolitan area using sidescan sonar: Northeastern Geology & Environmental Sciences, v. 19, no. 4, p. 243-262.
Schwab, W.C., Corso, W., Allison, M.A., Butman, B., Denny, J.F., Lotto, L., Danforth, W.W., Foster, D.S., O'Brien, T.F., Nichols, D.A., Irwin, B.J., and Parolski, K.F., 1997b, Mapping the sea floor geology offshore of the new York-New Jersey metropolitan area using sidescan sonar: preliminary report: U.S. Geological Survey Open-File Report 97-61, 2 sheets.
Schwab, W.C., Denny, J.F., Butman, B., Danforth, W.W., Foster, D.S., Swift, B.A., Lotto, L.L., Allison, M.A., and Thieler, E.R., 2000, Sea-Floor Characterization offshore of the New York - New Jersey metropolitan area using sidescan sonar: U.S. Geological Survey Open-File Report 00-295, 4 sheets. (Also available online at http://pubs.usgs.gov/of/of00-295/.)
Soren, J., 1971, Results of subsurface exploration in the mid-island area of western Suffolk County, Long Island, New York: Long Island Water Resources Bulletin no. 1, 60 p.
Suter, R., deLaguna, W., Perlmutter, N.M., 1949, Mapping of geologic formations and aquifers of Long Island, New York: State of New York Department of Conservation Water Power and Control Commission, Bulletin GW-18, 212 p.
Thieler, E.R., Butman, B., Schwab, W.C., Allison, M.A., and Danforth, W.W., 1999. Large relict bedforms at the distal end of the Hudson Shelf Valley result from a glacial break-out flood. Eos Trans. AGU, v. 80, no. 17 (supplement), p. S193.
Uchupi, E., Driscoll, N., Ballard, R.D., and Bolmer, S.T., 2001, Drainage of late Wisconsin glacial lakes and the morphology and late Quaternary stratigraphy of the New Jersey - southern New England continental shelf and slope: Marine Geology, v. 172, p. 117-145
Valentine, P.C., Unger, T.S., and Baker, J.L., 2001, Sun-illuminated sea floor topography of Quadrangle 18 in the Stellwagen Bank National Marine Sanctuary off Boston, Massachusetts: U.S. Geological Survey Geologic Investigations Series Map I-2718, scale 1:25,000.
Weiss, D., 1974, Late Pleistocene stratigraphy and paleoecology of the lower Hudson River Estuary: Geological Society of America Bulletin, v. 85, p. 1561-1570.
Westerink, J.J., R.A. Luettich, Jr. and J. Muccino, 1994, Modeling Tides in the Western North Atlantic Using Unstructured Graded Grids: Tellus, 46a(2):178-199.
![]() To view files in PDF format, download free copy of Adobe Acrobat Reader.
To view files in PDF format, download free copy of Adobe Acrobat Reader.
[an error occurred while processing this directive]
Map Sheet 1.
Map Sheet 2.

Figure 1.
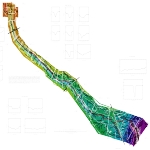
Figure 2.

Figure 3.

Figure 4.

Figure 5.
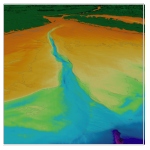
Figure 6.

Figure 7.
Map A.
Map B.

Map C.