Digital Mapping Techniques '03
— Workshop Proceedings
U.S. Geological Survey Open-File
Report 03–471
A Map of Lightning Strike Density for Southeastern Pennsylvania, and Correlation with Terrain Elevation
Millersville University
Department of Earth Science,
P.O. Box 1002,
Millersville, PA 17551-0302
Telephone (717) 871-4739; fax (717) 871-4725; e-mail alex.decaria@millersville.edu
INTRODUCTION
The National Lightning Detection Network™ (NLDN) consists of 106 sensors in a nationwide array (Orville and others, 2002) that detect and locate cloud-to-ground (CG) lightning strikes. Complete national coverage (with varying detection efficiency) began in 1989. The data from the NLDN are proprietary, and are controlled and distributed by Väiälä, Inc. Though extensive data sets must be purchased from Väiälä, Inc., the company makes limited data sets available for research at educational institutions at no charge. We were able to obtain 7 years worth of data (1995-2001) for southeastern Pennsylvania with the intent of comparing annual average lightning strike density with terrain elevation.
CREATING THE LIGHTNING DENSITY MAP
The lightning data were obtained in ASCII format, and included the position, in latitude and longitude referenced to the WGS 84 datum; the time of the strike, in Universal Time Coordinate, or UTC; and the signal, either negative or positive, depending on whether the strike lowers negative charge or positive charge to the ground, respectively. A Fortran 90 program was written to read the input file and write separate ASCII files for each year. The ASCII files were then opened using Microsoft Access database software to create database files readable by ArcGIS software. The Microsoft Access database files were read into ArcGIS, and from them, shape files were created for each year. Figure 1 shows the locations of all 80,487 lightning strikes recorded in Southeastern Pennsylvania during 2001 (only 1 year is shown because data for multiple years is too dense to show here). The county outlines were prepared by the Pennsylvania Department of Environmental Protection from data obtained from the Pennsylvania Spatial Data Access (PASDA) website, http://www.pasda.psu.edu/.
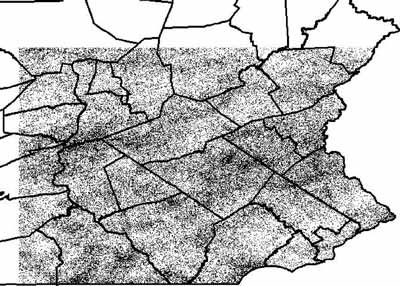 |
Figure 1. Location of all 80,487 lightning strikes recorded in southeastern Pennsylvania during 2001. |
Once the lightning strike positions were put into ArcGIS, the Spatial Analyst extension was used to calculate the strike density. The desired output units were number of strikes per square kilometer. Prior to calculating the density, the coordinates and projection were converted to an Albers equal area projection with coordinates in meters. A cell size and search radius of 1000 meters were used for the density calculations (this cell size was deemed suitable based on a conversation with Ken Cummins of Väiälä, Inc.). The strike densities were then corrected for the estimated detection efficiency of the NLDN for Southeastern Pennsylvania (provided by Väiälä, Inc.). The detection efficiency in 1995 was 61%, and increased to 80% in 1996 and 85% in 1997. From 1998 onward the estimated detection efficiency was 100%. After the strike densities for individual years were computed, they were averaged using the raster calculator feature of the Spatial Analyst extension to ArcGIS. Figure 2 shows the computed lightning strike density per year per square kilometer for 1995–2001.
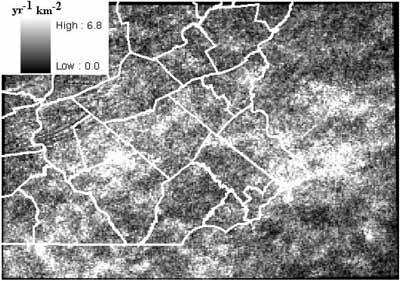 |
Figure 2. Computed lightning strike density in flashes per square kilometer per year (yr1 km2) for southeastern Pennsylvania from 1995–2001. |
CREATING A JOINED DATA SET OF LIGHTING STRIKE DENSITY AND TERRAIN ELEVATION
For comparison of strike density with terrain elevation, elevation data at a horizontal resolution matching that of the strike density data (1 km) were needed. The desired elevation data source was the U.S. Geological Survey (USGS) National Elevation Dataset (NED) provided by the Pennsylvania Topographic and Geologic Survey. Initially, this data set was resampled to a lower resolution by first converting the raster elevations into vector (point) format, and then converting back into a lower-resolution raster. This procedure overly taxed the memory of the personal computer used for the analysis, and caused the software to lock up. Therefore, a lower-resolution (~100 m) digital terrain model prepared by the Pennsylvania Department of Environmental Protection was downloaded from the Pennsylvania Spatial Data Access website and resampled to 1-km resolution (fig. 3). This difficulty was a direct result of our inexperience with the ArcGIS software. We have since learned a simpler and more efficient method of re-sampling the data to a lower resolution while remaining in raster format, and this has worked successfully on the USGS NED.
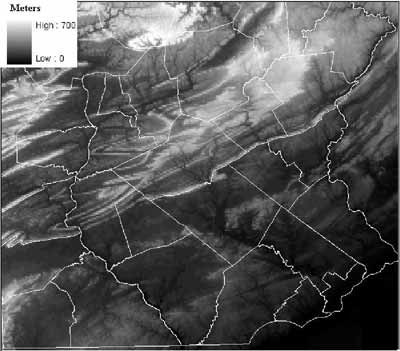 |
Figure 3. Low horizontal resolution (1 km) terrain for southeastern Pennsylvania. Units are meters. |
The location of the data points in the vector strike density data set and the vector elevation data sets were not coincident. In order to compare elevation with strike density the two vector data sets were first clipped to a common domain, and then joined using an ArcGIS function to interpolate the two vector data sets to a common set of points.
ANALYZING THE CORRELATION BETWEEN LIGHTING STRIKE DENSITY AND TERRAIN ELEVATION
Using the joined vector data set of lighting strike density and terrain elevation, the correlation between strike density and elevation was analyzed using scatter plots and standard statistical methods. The attribute table from the joined density-elevation data set was exported as an ASCII file and read into Microsoft Excel, from which the statistical analysis was performed.
Figure 4 shows a scatter plot of strike density versus terrain elevation for the entire domain. There is a weak, yet statistically significant, negative correlation between strike density and terrain elevation. The lack of a positive correlation between strike density and elevation implies that terrain elevation is not the dominant factor for thunderstorm formation in this region. There is a significant maximum in lightning strike density in Bucks County, which lies along the Delaware River and is relatively low and flat. Mechanisms such as the convergence associated with the bay breeze coming up the Delaware River Valley, or uplift due to frontal passages, appear to be more significant for triggering thunderstorms in this region. This is consistent with Orville and Huffines (2001), who found a minimum in lightning strikes over the high terrain of the Appalachian Mountains. Scatter plots were also created for several individual counties, and in no case was a positive correlation found between strike density and terrain elevation.
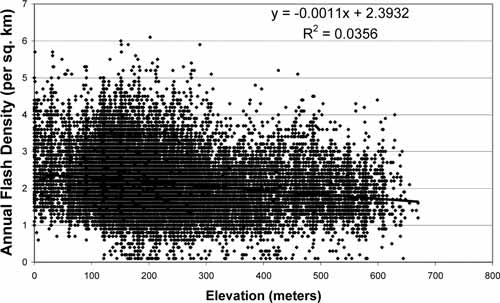 |
Figure 4. Scatter plot of strike density (yr1 km2) versus terrain elevation (m) for southeastern Pennsylvania. The negative correlation, though weak, is statistically significant. |
SUMMARY
ArcGIS was used to manipulate lightning strike position data and terrain elevation data so that the correlation between lightning strike density and terrain elevation for southeastern Pennsylvania could be explored. A statistically significant, weak negative correlation between lightning strike density and terrain elevation was found in southeastern Pennsylvania. This indicates that orography is at best a secondary factor for the formation of thunderstorms in this region, since we would expect to see a positive correlation if the thunderstorms were orographically forced.
ACKNOWLEDGMENTS
We would like to acknowledge Väiälä, Inc. for providing the lightning strike data free of charge for this research project. We are also thankful to Tom Whitfield of the Pennsylvania Topographic and Geologic Survey for providing elevation data and also advice and guidance regarding use of ArcGIS. This research was funded under a Millersville University Faculty Research Grant.
REFERENCES
Orville, R.E. and Huffines, G. R., 2001, Cloud-to-ground lightning in the United States: NLDN results in the first decade, 1989–98: Monthly Weather Review, v. 129, p. 1179–1193.
Orville, R.E, Huffines, G.R., Burrows, W.R., Holle, R.L., and. Cummins, K.L, 2002, The North American lightning detection network (NALDN)—First results: 1998–2000: Monthly Weather Review, v. 130, p. 2098–2109.