Digital Mapping Techniques '03
— Workshop Proceedings
U.S. Geological Survey Open-File
Report 03–471
Digital Geologic Mapping in a Data Rich, Urban Environment
West Virginia Geological and Economic Survey, P.O. Box 879, Morgantown, WV 26507-0879
Telephone (304) 594-2331; fax: (304) 594-2575; e-mail mccolloch@geosrv.wvnet.edu; janemc@geosrv.wvnet.edu
INTRODUCTION
Is it possible to use data from GIS databases designed to generate tax bills to produce geologic maps? This is the question that we posed before beginning a pilot project in 2002, to map the West Virginia portion of the Lake Lynn 7.5-minute quadrangle and to explore utilizing pre-existing GIS data to produce geologic maps.
HISTORY OF DATA COLLECTION IN THE PENNSYLVANIAN OF WEST VIRGINIA
The West Virginia Geological and Economic Survey (WVGES) was established in 1897. Its initial tasks were to produce summary volumes on various resources or areas of interest and to produce a series of “county reports” with accompanying geologic maps. The commonly used term, “county report,” is a misnomer; many include more than one West Virginia county, although the counties are always adjacent and geologically closely related. The fieldwork for each report was completed in a single field season. By modern standards the fieldwork appears to have been rushed. Errors of interpretation were, understandably, fairly common in geologically complex areas. Although some types of exposures like small underground mines and railroad cuts were common, others, notably surface mines and large highway road cuts, did not exist. The fieldwork produced much usable data, most of which was published. County reports were published between 1907 and 1939, with a significant hiatus during the Depression years when funding was more limited than usual.
The second phase of agency history, from 1939 through approximately 1970, involved studies such as “Germanium in Coals of West Virginia” or “Geology and Economic Resources of the Ohio River Valley in West Virginia” that focused on more specific themes and areas than the previously mentioned county report series. During this period, significant work by Thomas Arkle and Dr. Aureal T. Cross was conducted in the Pennsylvanian rocks of West Virginia. In addition, A. J. W. Headlee, John P. Nolting, Jr., Homer A. Hoskins, Ralph E. McClelland and Richard G. Hunter accomplished much coal analytical work. The works of these individuals contributed to the knowledge base provided by the county reports (West Virginia Geological Survey, 1963). During this period, the county report maps were generalized to produce an up-to-date 1:250,000 geologic map.
The next phase of Pennsylvanian studies at the WVGES began in the early 1970’s, when the legislature appropriated funds to begin a new data collection effort in the Pennsylvanian coal measures. The resulting project was called the “Coal Resources and Pollution Potential Study.” Funding for this study was gradually reduced in the early 1980s and employees left the agency or were reassigned to other work. Funding to publish results was not provided. Although few formal publications resulted, this study produced a large body of carefully organized raw data and useful working maps, which were given open-file report status. This collection has been extensively used for many purposes over the past 25 years.
The final chapter of Pennsylvanian data collection and publication began in 1995. A long-term controversy concerning how West Virginia mineral resources were taxed erupted into the courts. The settlement made funding available for a new appraisal methodology, and the WVGES was charged with project management and development of GIS-based models of mineral resources. The West Virginia Division of Tax and Revenue was responsible for developing a statewide GIS-based mineral property database. Funding was also provided for a private consultant to develop appraisal methodology and software, to establish a GIS Technical Center at West Virginia University, and to hire a state GIS Coordinator. The resulting project, including all participants, was termed the Mineral Lands Mapping Project (MLMP).
As the WVGES has been developing a georeferenced database of oil and gas well information since the 1960s, the major part of the MLMP at WVGES involves the compilation of all available coal information into GIS databases. This effort is termed the Coal Bed Mapping Program (CBMP). As a rich body of raw field data is available from the efforts of the earlier Coal Resources and Pollution Potential Study and core logs provided by the coal industry, the CBMP involves the completion of data collection from tens of thousands of mine maps and the compilation of all of this data into a large statewide GIS data set. Major products of CBMP include the following 1:24,000 coverages and grids for each major coal seam:
Although primarily produced to characterize mineral resources, several of these coverages and grids are useful for geologic mapping. The mining layer is also useful for environmental applications.
GEOLOGIC MAPPING
Although coal beds are considered “informal units” in the North American Stratigraphic Code (The North American Commission on Stratigraphic Nomenclature, 1983), they are frequently the most continuous, traceable units in the Pennsylvanian rocks of the Appalachian Basin. For this reason they are frequently used as rock unit boundaries. Geologic mapping utilizing CBMP data is possible because a few major coal beds form the boundaries of some mapping units in the region (fig. 1). The boundaries of pre-Pennsylvanian non-coal bearing units can be obtained by creating structure contour maps of various horizons using georeferenced oil and gas well data.
 |
Figure 1. Section from Fonner and others, 1981, illustrating coal beds bounding mapping units. |
The CBMP product includes two carefully developed GIS data sets: a polygon coverage representing the extent of each important coal bed, and elevation grids representing the structure of each coal bed. The grids are divided into quadrangle-sized areas for convenience in processing. Boundaries of polygons that represent coal bed outcrops are carefully determined; however, the boundaries of polygons that represent the extent of coal beds below drainage or where no mining has occurred are somewhat subjective. The procedure for generating coal bed outcrops involves intersecting the coal bed structure grids and the grids representing the elevations of the surface by subtracting the value of the surface elevation from the elevation of the coal beds and contouring the zero value. This single contour line represents an approximate version of the outcrop (fig. 2). This outcrop line is then edited by overlaying it on a carefully georeferenced image of the 7.5-minute topographic map to incorporate indications of the outcrop position such as underground mine openings, surface mines, and breaks in slope.
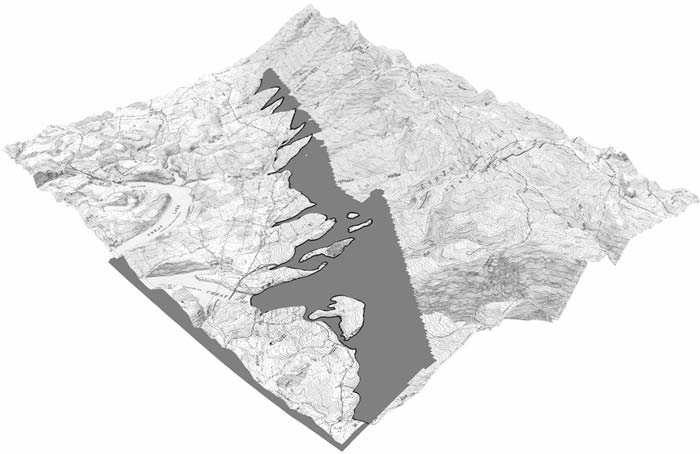 |
Figure 2. Image of Lake Lynn 7.5-minute topographic quadrangle draped over an elevation model of the quadrangle. The gray horizon represents the base of the Upper Freeport coal. The black row of pixels at the intersection represents an approximate outcrop defined by contouring the intersection of the coal and the land surfaces. |
The Northern Appalachian Coalfield is known to have consistent sedimentary thicknesses. This regularity is not only true of the Pennsylvanian, but also of older units occurring near the surface. This allows extrapolation of important contacts within stratigraphic units. The important basin-wide unconformity between the Harlem coal bed and the Ames Limestone, which represents the last marine incursion into the Appalachian Basin, is mappable{?} on the Lake Lynn 7.5-minute quadrangle. For mapping purposes, this contact was generated by determining the interval between the Harlem/Ames contact where it was well exposed in a highway road cut on an adjacent quadrangle and the underlying Upper Freeport coal (see fig. 1). An outcrop line for this contact was extrapolated using the elevation grid of the Upper Freeport coal. The placement of this contact was verified by comparison of features on the Lake Lynn topographic map and field observations.
This comparison showed that the procedure described above to map the unconformity between the Harlem coal and the Ames Shale allowed correlation of the coal mined in a surface mine on the quadrangle and positive identification of an outcrop exposed when the level of Cheat Lake was dropped for sewer line construction in the spring of 2003. The location of the Pittsburgh and Upper Freeport coal outcrops was correctly delineated on the CBMP dataset with the exception of one area where the elevation of the Upper Freeport coal had to be corrected to agree with field observations.
URBAN MAPPING
Although West Virginia is well known as one of the least urbanized states in the United States, it does have some urban areas. One of the latest to be formally recognized, as a result of the 2000 census, is the Morgantown Metropolitan Statistical Area, which includes Monongalia and Preston counties. This designation has generated the need for up-to-date geologic maps that incorporate all available data.
Some unique issues need to be addressed when collecting data and producing maps in urban areas. The first is access. Greater employment opportunities are drawing people to the metropolitan areas. Two-income households are becoming more common in these areas of West Virginia, and an increasing number of property owners are not at home during the day. Near the boundaries of the Morgantown urban area, relatively small properties display a profusion of “No Trespassing” signs. Unlike the farmers of more rural areas of the state, the residents are frequently absent when a mapper wants to ask permission for access. Most do not understand why a geologist wants to look at the rock outcrop in their backyard. The rich body of pre-existing data, including several generations of air photos and other aerial imagery, is useful because field observations can frequently be made from public roads and other accessible areas.
The second issue is locating unit contacts as accurately as possible. One instance illustrates this point. The WVGES received a call from a consultant working in MacAurthur, West Virginia, near Beckley, in the early 1980s. The initial question concerned the interval between the Sewell and the Beckley coals. While digging a ditch for a new sewer line, a backhoe had cut into old mine works. Apparently a preliminary WVGES map showed the outcrop of the Sewell coal was located on the hillside above where the ditch was being dug, and the consultant assumed the old mine works were in the stratigraphically lower Beckley coal. At this location the interval between the Beckley and Sewell coals is about 285 feet. The difference in elevation between the Sewell coal contact on the map and that of the old mine works was less than 40 feet, which ruled out the old mine works being in the Beckley coal. The mapped location of the outcrop was slightly inaccurate, and the seam in question was undoubtedly the Sewell.
Soon afterward, one of the authors drove by the site and found a mine subsidence control project located at a nearby West Virginia Department of Natural Resources, Abandoned Mined Lands Office. That agency was desperately attempting to save the buildings, which were adjacent to the sewer line ditch (fig. 3). The buildings predated the preliminary map, but had the subsiding buildings been sited using information from the map, the WVGES might have been held responsible. This experience and many others have led to a realization of how critical the location of a geologic contact or outcrop can be, especially in areas where the population is increasing.
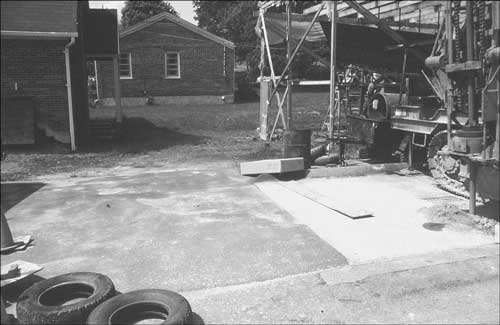 |
Figure 3. Subsidence damage and abatement effort at MacAurthur, West Virginia. Notice damage to foundation of brick building at left of photo. |
The scale problem associated with some symbols used on topographic maps is another urban mapping issue that could adversely affect the quality of an urban geologic map. Most geologists are aware that several classes of symbols used on topographic maps are not printed to scale. The scale of symbols is not very important on maps of rural areas where adequate space exists so that oversized symbols can be plotted at true locations of the features they represent. Some attempts have been made to work around this problem on maps of urban areas such as generalizing some features, omitting features, or adding red overlays.
Streets depicted on the topographic map do not necessarily represent the actual street location or geometry. A neighborhood in Morgantown was chosen to illustrate this problem. This neighborhood was developed in the early 1900s and was designed to fit existing, moderately steep topography and to limit the number of through streets. Many streets have curves. Figure 4 shows that the DLG data derived from separates of the topographic maps do not agree with the imagery in several areas.
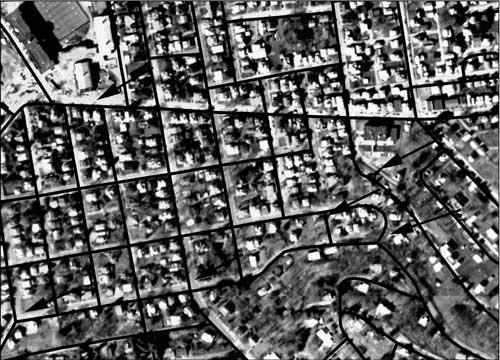 |
Figure 4. Part of the South Park neighborhood, Morgantown, West Virginia. Georeferenced image produced by Positive Systems Corporation in 1997 overlaid with the street centerlines from the USGS DLG of the Morgantown South 7.5-minute topographic quadrangle. Both data sets have identical projections. Black arrows indicate some significant errors in the location of streets in the DLG. |
CONCLUSIONS
Geologic mapping is possible in much of north-central West Virginia using existing CBMP datasets; however, traditional fieldwork is critical in areas where little or no pre-existing data is available and/or new exposures are being created as development occurs. Urban geologic mapping requires a degree of accuracy that is not generally regarded as necessary in rural geologic mapping. Using georeferenced digital orthophotography for basemaps is preferable to using topographic maps. Urban mapping requires the use of best available aerial photos and software to allow three-dimensional data development and editing.
REFERENCES
Fonner, R.F., Reynolds, J.H., Cole, G.A., Jake, T.R., Fedorko III, N., and Connell, D.A., 1981, Geologic cross section and apparent structure along the West Virginia portion of U.S. 48: West Virginia Geological and Economic Survey, 65 p.
The North American Commission on Stratigraphic Nomenclature, 1983, North American stratigraphic code: American Association of Petroleum Geologists Bulletin, v. 67, no. 5 (May, 1983), p. 841–875.
West Virginia Geological Survey, 1963, The West Virginia Geological and Economic Survey: Its accomplishments and outlook: West Virginia Geological and Economic Survey, 207 p.