Digital Mapping Techniques '03
— Workshop Proceedings
U.S. Geological Survey Open-File
Report 03–471
The National Park Service Geologic Resources Inventory “From Paper to Digital: Exploring a Geologic-GIS Map”
1Colorado State University/National Park Service Cooperator, 1201 Oak Ridge Drive, Suite 200, Fort Collins, CO 80525
(970) 225-3584; Stephanie_O'Meara@partner.nps.gov;
Tthorn@cnr.colostate.edu;
vdew@holly.colostate.edu
2National Park Service – Geologic Resources Division, 12795 West Alameda Parkway, Lakewood, CO 80228
(303) 969-2093; Anne_Poole@nps.gov
INTRODUCTION
Bedrock and surficial geologic maps and supporting information provide the foundation for studies of ecosystems, earth history, groundwater, geomorphology, soils, and environmental hazards such as fire history, landslide and rockfall potential. Geologic maps describe the underlying physical conditions of many natural systems and are an integral component of the physical science inventories stipulated by the National Park Service (NPS) in its Natural Resources Inventory and Monitoring Guideline. The NPS has identified geographic information systems (GIS) and digital cartographic products as fundamental resource management tools. There are few geologists employed at parks, thus these tools are particularly important to the National Park Service to aid resource managers in using geologic data for park management decisions.
The NPS is developing most of its digital products in ESRI’s (Environmental Systems Research Institute) ArcView GIS. ArcView 3.X interfaces effectively with other software running on the Microsoft Windows operating system. Also, integrating a variety of tools including the NPS GIS Theme Manager and Microsoft Visual Basic graphics viewer program (both are available at http://www1.nature.nps.gov/im/apps/thmmgr/index.htm), Windows Help software, and the ArcView legend editor has allowed users to display geologic map information in a digital GIS. O’Meara (2002), Connors (2002) and Fryer (2001) present additional detail of NPS guidelines for producing and presenting digital geologic maps.
BRINGING IT ALL TOGETHER
This poster details the steps entailed in transforming a paper geologic map to a user-friendly digital geologic map and database. Our ultimate goal is to have a comprehensive digital geologic-GIS map for 273 park units across the United States. This process begins with identifying existing data and getting it into a digital format. In the hopes of preserving all aspects of the original paper map, features are identified and attributed, preserving all information related to the feature (i.e. type of feature, positional accuracy and/or concealment, feature name, measurement value etc.). As well, color and symbology are matched to the extent possible using ArcView 3.3. Each map covering a portion of a park unit is then edge-matched to adjacent maps, and appended to create a compiled map of the park unit.
The compiled map includes links to graphics such as cross sections for easy viewing. GIS analysis is facilitated for our data with attributes such as unit names, feature types, measurement values, relative ages, and other feature characteristics, which are contained in the relational database. In addition to this database, a help file is linked to the GIS data to provide detailed feature descriptions. FGDC-compliant metadata for each digital map provides supporting reference and geospatial information.
Taking Stock. . .An Index Map
For Zion National Park our process of building a map database began with the determining the USGS 7.5 minute geographic quadrangles that included the park. We inventoried the preexisting published maps, taking note of their map scale and format (i.e. paper or digital). With the cooperation of the Utah Geological Survey, we then acquired digital data for 9 of the 11 quadrangles, mapped at 1:24,000 scale, that comprise the park (Fig. 1).
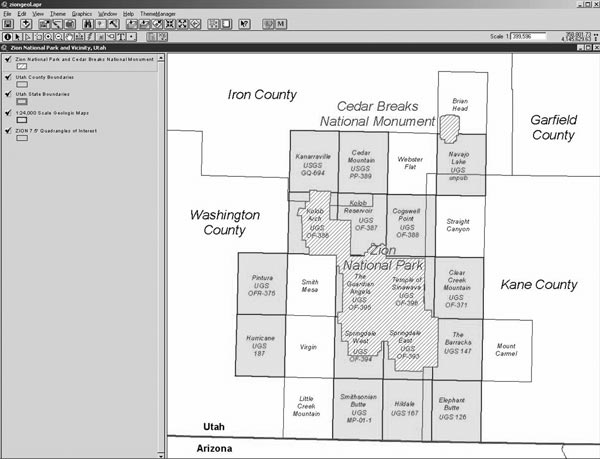 |
| Figure 1. Index map of 1:24,000-scale geologic maps (shaded areas) for Zion National Park displayed in ArcView 3.3. Image shows park boundary extent (diagonal hatched area), USGS 7.5 minute quadrangles of park interest, Utah county boundaries, and Utah-Arizona state boundary. Nearby Cedar Breaks National Monument is also displayed. |
The Next Step. . .Identifying Map Features and Converting Data
For every map, a different set of geologic features must be captured. Features range from geologic unit areas to sample point localities. The National Park Service uses ArcView 3.X as its standard software. As mandated by this software, all features are assigned a spatial feature type such as polygon, arc, or point. In a cooperative relationship with the Utah Geological Survey (UGS), we received and converted their existing GIS digital data into our National Park Service Geology-GIS Data Model (O’Meara, 2003). Table 1 lists features present in Zion National Park, their spatial feature type or representation, and the corresponding NPS Geology-GIS Data Model data layer.
| Table 1. Identified geologic features, their spatial representation type, and their corresponding NPS Geology-GIS Data Model data layer (coverage). These apply to geologic maps for Zion National Park. | ||
|
Geologic Feature Type
|
Spatial Feature Type
|
NPS Data Model Coverage
|
|---|---|---|
| Geologic Unit Areas | Polygon | Area Geologic Units and Contacts (GLG) |
| Geologic Units Mapped as Linear Features | Arc | Linear Geologic Units (GLN) |
| Geologic Units Mapped as Point Features | Point | Point Geologic Units (GPT) |
| Geologic Fault Lines | Arc | Geologic Faults (FLT) |
| Geologic Fold Axes | Arc | Geologic Folds (FLD) |
| Geologic Field Attitude Measurements | Point | Geologic Attitude Observation Points (ATD) |
| Prospects, Adits, Shafts and Other Mine Related Features | Point | Mine and Mine Related Point Features (MIN) |
| Volcanic Vent Sources | Point | Volcanic Point Features (VNT) |
| Geologic Sample Localities | Point | Geologic Sample Points (SAM) |
| Geologic Structure Contour Lines | Arc | Contour and Other Lines (LN#) |
| Lineaments in Surficial Deposits | Arc | Contour and Other Lines (LN#) |
| Joints Mapped as Linear Features | Arc | Linear Joints (JLN) |
| Geologic Cross Section Lines | Arc | Cross Section Lines (SEC) |
| Landslide Scarp Lines | Arc | Linear Hazard Features (HZL) |
| Collapse Feature Localities | Point | Hazard Point Features (HZP) |
The Barracks Quadrangle Digital Geologic Map. . .One of 9
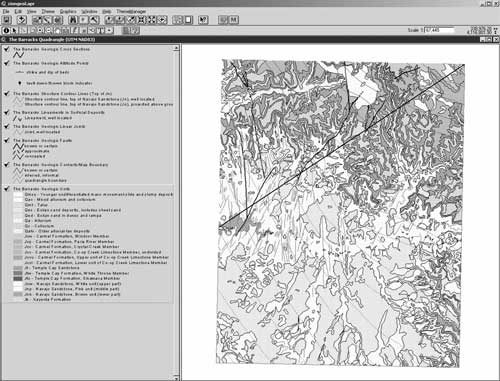
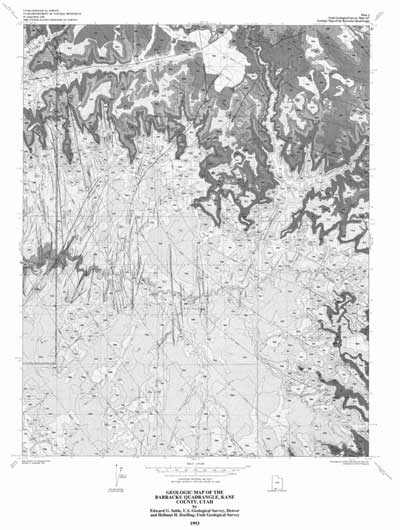
Figures 2a and 2b show the converted digital map and a scan of the original published paper map for one quadrangle at Zion National Park. Our goal is to have a digital map that “looks and feels” like the published source map. For example, we sampled colors from the original map to use for the presentation of the area geologic units, and we selected and scaled symbols available in ArcView 3.3 legend palettes to best reproduce the symbology of the original map.
 |
 |
|
| Figure 2a. The Barracks digital geologic map displayed in ArcView 3.3. | Figure 2b. For comparison, a scanned image of The Barracks paper source map. |
Many Become One. . .9 Quadrangles Make a Compiled Zion National Park Digital Geologic Map
Upon conversion of inherited Utah Geological Survey data, area and arc/line data layers (coverages) were edge-matched to align continuous features from one quadrangle map to another. These coverages were then appended to create a compiled coverage for the entire park map (fig. 3).
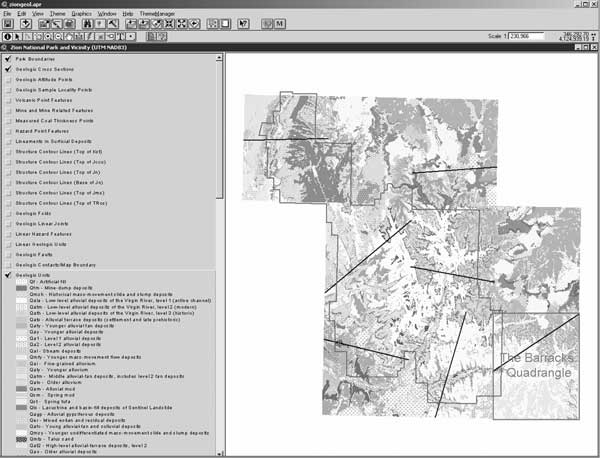 |
| Figure 3. The compiled Zion National Park and vicinity digital geologic map, displayed in ArcView 3.3 |
It’s Hot. . .Linked
Using the NPS GIS Theme Manager in ArcView, a cross section graphic can be displayed at the user’s whim with a simple click of the mouse (fig. 4).
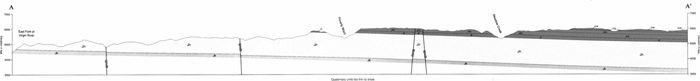 |
| Figure 4. A geologic cross section, displayed in ArcView 3.3 using the NPS GIS Theme Manager extension. |
Attribution, Attribution, Attribution! Its Not Just Digital Cartography Anymore
In pursuit of a useful GIS, all features captured in the digital geologic map are attributed with descriptive information contained on the paper map. Our National Park Service Geology-GIS Data Model dictates how information such as: 1) feature type, 2) feature positional accuracy and/or concealment, 3) feature name, 4) measurement value, 5) relative age, 6) feature notes, and 7) source map identification is assigned as attribution. Figure 5 shows Data Model attribution for geologic units in Zion National Park and vicinity.
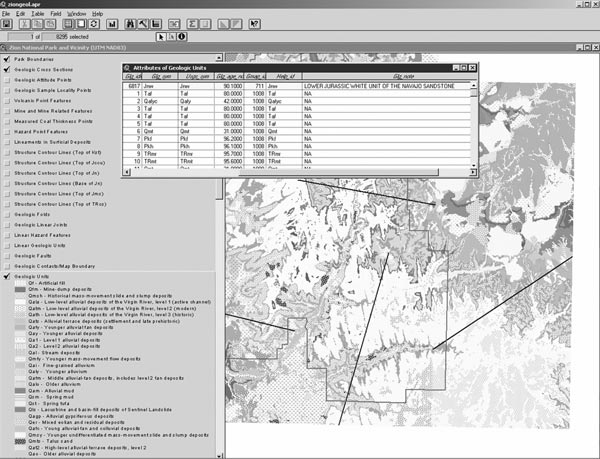 |
| Figure 5. Part of the NPS Geology-GIS Data Model attribute table for area geologic units displayed in ArcView 3.3 |
The Database Enters the Picture
With relational tables storing additional feature attribution such as geologic age, formation name, member name, geologic age, and lithologic type, a database emerges. The added functionality allows for more advanced querying and geospatial analysis.
Help! I Need a Help File, Not Just Any Help File
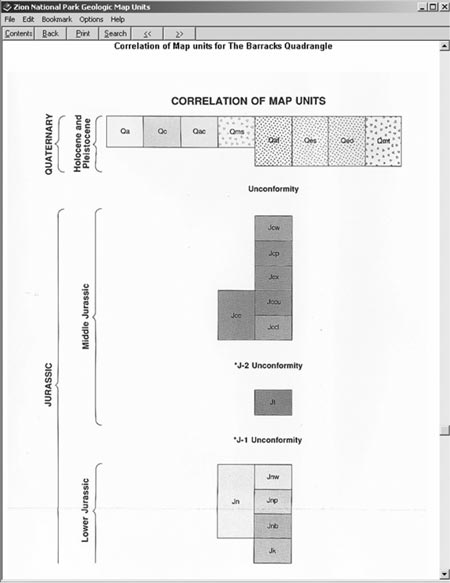
To preserve even more data from the original source map, ancillary information such as map unit descriptions, map notes, references, figures and reports are compiled into a Windows help file (figs. 6a and 6b). These help files feature keyword searchability and topical organization. The help file is linked to the area geologic units of the digital geologic map.
 |
 |
|
| Figure 6. Title page, geologic unit description page, and correlation of map unit help file page in the Zion National Park map windows help file. |
Those Two Four Letter Words. . .Metadata, FGDC Style
In compliance with Federal Geospatial Data Committee guidelines, metadata is produced for all GIS data layers (fig 7). To produce FGDC metadata records, metadata template files are populated with information specific to the GIS data including source map reference information, keywords and process steps used in the creation of the data. The edited template file is then imported into ArcCatalog, which harvests map data layer-specific geospatial information such as projection, types of features, and spatial domain.
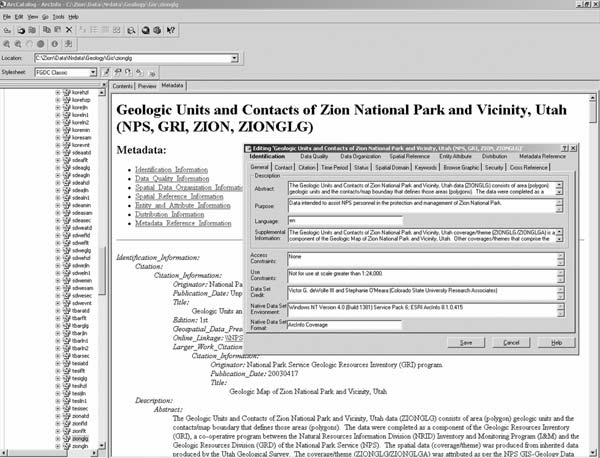 |
| Figure 7. Editable FGDC compliant metadata displayed in ArcCatalog. |
CONCLUSION
The National Park Service has identified digital geologic-GIS maps as an integral component in managing the natural resources of its parks. The process of producing a digital geologic-GIS map begins with identifying existing data. If digital data is available, the next step is getting the data into a standard format using the NPS Geology-GIS Data Model. The Data Model dictates how geologic features are captured and organized in a digital GIS, and how information associated with a geologic feature is recorded in GIS attribution. For park maps that are composed of more than one map, adjacent maps are edge-matched to align features that are continuous from one map to another. These individual maps are then appended to create one park map. Ancillary information such as geologic unit descriptions and map notes as well as cross section graphics associated with source maps are converted into digital format, and presented in a digital GIS using tools developed by the NPS. Lastly, FGDC compliant metadata is produced for each geologic data layer.
SOFTWARE REFERENCES
ArcInfo 8.3, ArcView 3.3 - Environmental Systems Research Institute (ESRI) Inc., 380 New York St., Redlands, CA 92373, http://www.esri.com/
REFERENCES
O’Meara, S. A., Poole, A. R., deWolfe, Victor and Thornberry, T. L., 2003, National Park Service Geology-GIS Data Model, http://www1.nature.nps.gov/im/gis/GeologyGISDataModel.htm
O’Meara, S. A., Connors, Tim, Thornberry, T. L., Gregson, J. D., Poole, A. R., and Heise, B., 2002, The National Park Service Geologic Resources Inventory and from Paper to Digital: a Geologic Map’s Odyssey, in D.R. Soller, ed. Digital Mapping Techniques ’02—Workshop Proceedings: U.S. Geological Survey Open-File Report OF–02–370, http://pubs.usgs.gov/openfile/of02-370/omeara.html
Connors, T., O’Meara, S. A., Thornberry, T. L., Gregson, J. D., Poole, A. R. and Heise, B., 2002, The National Park Service Geologic Resources Inventory: An Update, in D.R. Soller, ed. Digital Mapping Techniques ’02—Workshop Proceedings: U.S. Geological Survey Open-File Report OF–02–370, http://pubs.usgs.gov/of/2002/of02-370/connors.html
Fryer, S., Gregson, J., Connors, T., Poole, A., and Heise, B., 2001, The National Park Service Digital Geologic Map Model: Transformation from Paper to Digital, Featuring Legends, Cross Sections, Map Notes and Keyword Searchability, in D.R. Soller, ed. Digital Mapping Techniques ’01—Workshop Proceedings: U.S. Geological Survey Open-File Report 01-223, p .87–100, http://pubs.usgs.gov/openfile/of01-223/fryer.html.
Sable, Edward G., and Doelling, Helmut H., 1993, Geologic map of the Barracks quadrangle, Kane County, Utah: Utah Geological Survey Map 147, 1:24,000 scale.