Digital Mapping Techniques '03
— Workshop Proceedings
U.S. Geological Survey Open-File
Report 03–471
The National Geologic Map Database Image Library—Technical Details
1U.S. Geological Survey, 1300 SE Cardinal Ct.,Vancouver, WA 98683
Telephone (360) 993-8908; fax (360) 993-8980; email: rwardwell@usgs.gov
2U.S. Geological Survey, National Center, Reston, VA 20192
email klaurent@usgs.gov, jskog@usgs.gov, drsoller@usgs.gov
INTRODUCTION
The Geologic Mapping Act of 1992 and its reauthorizations mandate creation of a National Geologic Map Database (NGMDB), to serve as a “national archive” of geoscience maps. The U.S. Geological Survey (USGS) and the state geological surveys (through the Association of American State Geologists, or AASG) are collaborating on the design and the many components of the NGMDB. Consistent with the Act’s intention, the NGMDB project’s overall objective is to provide the public with information and access to products that may be needed for purposes ranging from decision making to education and personal interest. The mandate is at least partially fulfilled through the NGMDB’s Map Catalog (Soller and Berg, this volume; Soller and Berg, 1999) and its ancillary database, the Image Library. In this paper and in the companion paper in this volume, we discuss the relationship between the Image Library and the NGMDB Map Catalog, the ability for this library to link to outside resources, and its technological underpinnings.
In June, 2002, the NGMDB project began to build the Image Library, in order to meet the growing demand of Map Catalog users who simply wish to view a geologic map via their Web browser. The Image Library is now collecting and archiving scanned raster images of general purpose bedrock and surficial geologic maps. By archiving compressed digital raster images or links to available resources in various locations, the Image Library will provide a single vantage point from which users can find a geologic map to suit their needs. Once found, any map can be viewed through a standard Web browser as compressed image data in Multi-resolution Seamless Image Database (MrSid) format with no visible loss in image quality (see Soller and Berg article on the Image Library, this volume; fig. 3). Built-in zoom and pan capability allow the client to navigate a geologic map at multiple zoom levels without excessive pixelation. This allows users to clearly read even the finest details of the map, such as the legend descriptions and stratigraphic column information.
This paper discusses the technology behind the Image Library Web application, and the approach taken to meet the initial project requirements shown in figure 1. The Technical Overview section briefly describes the Library’s computer infrastructure. For those readers who wish to learn more about the individual project components, such as database structure, Web content management, and online user interface development, please read the section on Web Application Development. Readers interested in learning more about how their organization can contribute maps to the Image Library will find this discussion in the companion paper in this volume.
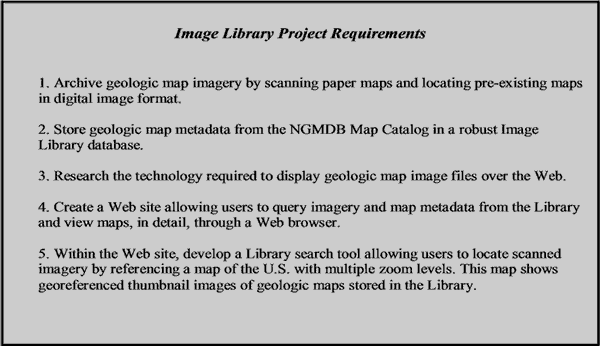 |
Figure 1. Project requirements established early in the Image Library development phase. |
TECHNICAL OVERVIEW
On a daily basis, the NGMDB Map Catalog is queried for records on bedrock and surficial geologic maps, and the query results are stored in the MySQL Image Library database. A paper or scanned digital copy of each map identified from the Map Catalog is then located. Most often, this is done by searching the library catalog at the USGS National Headquarters library in Reston, Virginia; maps are checked out of the library and scanned by USGS employees. In the future, the Library will include maps from a variety of sources, and provide an avenue for state geological surveys to disseminate their map imagery.
Paper maps are scanned full size at 300 dots per inch (dpi) and saved in TIFF format. These files are compressed at a ratio of 20:1 using the MrSID format. This technology was first developed at the Los Alamos National Laboratory (LANL) and later acquired by LizardTech Software, Inc. (http://www.lizardtech.com/). MrSID imagery files for geologic maps are typically 15–25 MB in size. Both TIFF and MrSID format images are archived on CD/DVD media. One or several MrSID images for each publication are stored on an Image Library Web server so they can be accessed through a Web interface and viewed online.
The Image Library currently contains 950 scanned bedrock and surficial geologic maps, with approximately 1300 raster images in MrSid format, accounting for publications that have multiple sheets. With over 23,000 USGS and state survey maps that may be scanned and put online listed in the database, it is apparent that the Image Library must be extensible and designed for growth. Careful thought has gone into designing a system that will allow a small staff to manage the large amount of raster imagery and metadata that must be collected, organized, and made easily accessible to the public via Web technology.
Figure 2 illustrates the major components of the Image Library IT infrastructure. The prototype Web server, located at the USGS National Headquarters in Reston, Virginia, hosts a relational database used to store limited metadata for each selected geologic map. The database also stores information about scanned imagery, and is crucial for tracking events and progress associated with map scanning. In order to grant users access to the contents of the database via the Web, the database has been linked to a Web content server and image server. This allows for newly acquired metadata and imagery to be dynamically incorporated into the Image Library Web pages. This system allows the staff to focus less on IT development and more on the acquisition of new imagery.
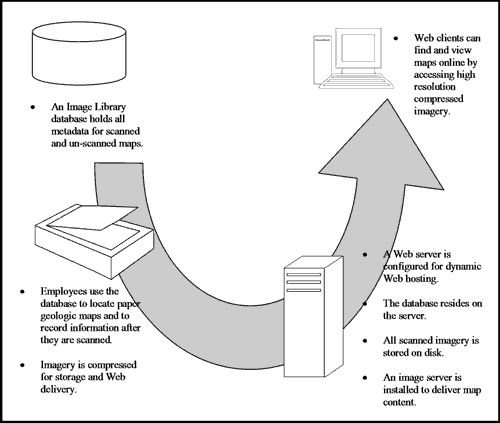 |
Figure 2. Major components of the Image Library. |
Figure 3 shows in more detail the hardware and software chosen to perform the actions described above. MySQL, a robust open source database, holds all map metadata (the map title, author, publisher, year, scale, geologic theme, media, and geographic bounding coordinates) and is regularly synchronized with the NGMDB Map Catalog Oracle database that is hosted in Flagstaff, AZ. The MySQL database holds links to a collection of MrSid format raster imagery residing on the server so that each image file is joined to the geologic map metadata.
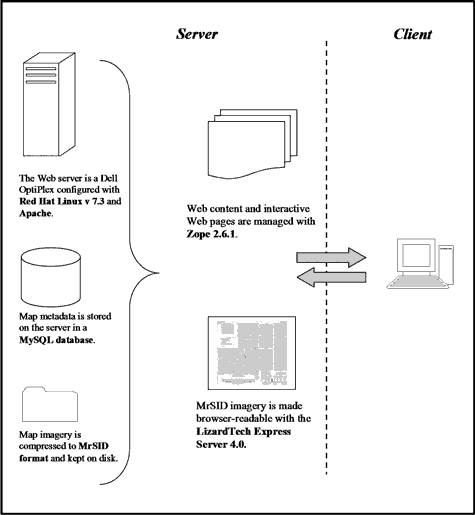 |
Figure 3. Hardware and software chosen to manage the Image Library. |
The LizardTech Express Server, a proprietary software for displaying MrSid images on the Web, is used to convert map imagery into a Web-friendly format (it delivers manageably-sized blocks of data to the user’s Web browser) and to generate thumbnail jpeg images for each map. These thumbnail images, as discussed below, are important for maintaining the Web interface that enables users to search the Image Library.
Data from the MySQL database are brought together with the Web-ready imagery and transformed dynamically into Web pages by the Zope content management software. Zope is a powerful, open source solution for developing database-driven Web sites. With its own extensive object database, Zope allows Web programmers to insert bits of logic, such as a SQL database query, into a Web page so that users can interact with and search the database. In addition, Zope allows Website designers, those more concerned with the “look and feel” of the Website, the ability to create Web pages using standard HTML(Hyper Text Markup Language) code, or a WYSIWYG (What You See Is What You Get) editor.
Once user requests from the Web browser have been processed by Zope, standard HTML output is delivered to Web clients via Apache Web Server. The code needed to provide dynamic content is hidden to the user because Zope generates new HTML code each time a page is refreshed. Because Zope is so tightly integrated with the Image Library MySQL database, it also has been used to generate a Web accessible database front end (data input forms, query forms, and others) that the USGS staff uses to maintain metadata and imagery.
As seen in figure 4, a Web interface to the Image Library provides search tools that allow viewers to see where geologic map imagery is available. This geographic search interface is created without the help of a Web GIS server, such as ArcIMS, or a method for geo-referencing each individual map in the Library. Instead, the approach uses a unique combination of Extensible Markup Language (XML)-derived Scalable Vector Graphics (SVG) and JPEG image maps that are created directly from information in the database. This and several examples of how automated scripting has consolidated the work required to maintain the Web site are described in the following sections.
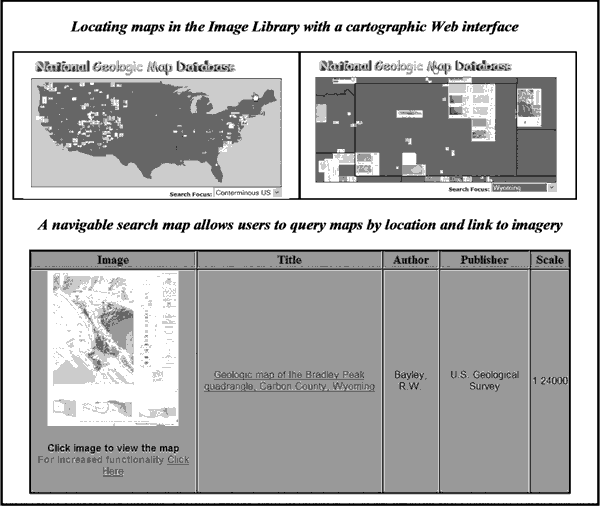 |
Figure 4. The Image Library website is used to locate, view, and download geologic map imagery. An intuitive search map makes it easy to see where map imagery is available. |
WEB APPLICATION DEVELOPMENT
Web Server
The first step towards developing the Image Library was choosing an adequate machine to act as a Web server, with enough disk space for a significant amount of data storage. A Dell OptiPlex GX400 PC with 160 gigabytes of disk space has been configured with the Red Hat Linux v.7.3 operating system. Red Hat Linux is a well-documented and tested operating system commonly used in Web server applications. Several versions of the operating system are freely available for download at http://www.redhat.com/.
Database
MySQL v.4.0.1 is currently installed on the Image Library server to collect and store map metadata and to keep track of raster imagery. MySQL is the database of choice due to its ease of use and its track record in mission critical applications designed for the National Aeronautics and Space Administration (NASA) and companies such as Yahoo!, Finance, MP3.com, Motorola, Silicon Graphics, and Texas Instruments. The database is freely available for download at http://www.mysql.com/ and licensed through the GNU (GNU is a recursive acronym for “GNU’s Not Unix”) General Public License (GPL).
The MySQL Image Library database receives daily updates from the NGMDB Map Catalog Oracle 8.0.6 database through a series of shell scripts. These scripts, residing as chron jobs on the Image Library server, query the NGMDB Map Catalog for all geologic maps listed as “bedrock” or “surficial.” Query output from the Map Catalog is formatted as tab delimited text and automatically loaded into the appropriate tables in the Image Library MySQL database.
Figure 5 shows how data is stored in MySQL. The database has been designed to perform three tasks. First it must store current information queried from the Map Catalog’s Oracle database, as previously noted. This is handled by the maps table which contains a unique identifier, pub_id, for each map and its additional attributes. This table contains no duplicate records and stores the title, author, publisher, publication year, scale, media, bounding coordinates, and theme of each map. In the Map Catalog, each publication may have many themes (bedrock geology, surficial geology, coal, earthquakes). When scripts cause data to be loaded into MySQL, this theme information is processed so that each map is assigned an integer value key to the appropriate theme or themes in the class table. This allows the Image Library to label maps that are both “surficial” and “bedrock” in a single field.
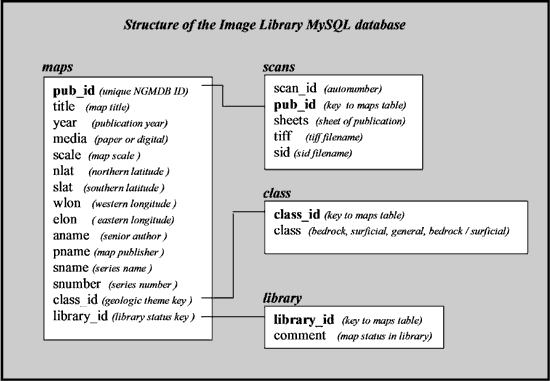 |
Figure 5. The MySQL Image Library database stores geologic map metadata, a listing of raster imagery, and a record of which maps have been scanned and which have not. |
The second task handled by the MySQL database is to track maps for which we have a scanned image, and provide a link to the image files on the server. The scans table is linked to the maps table on the pub_id field in a one-to-many relationship (because a map may have many map sheets). Because the MrSid imagery is stored in a server directory that is not part of the database, the scans table stores filenames that follow a standardized naming convention. This naming convention, illustrated in figure 6, is useful in managing imagery because the map scale, unique identifier (pub_id), sheet number, and publisher information can all be deduced from the filename.
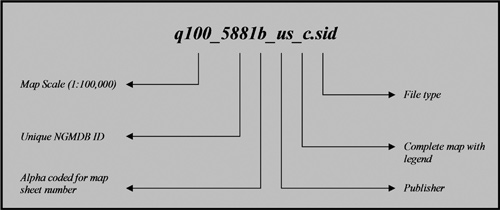 |
Figure 6. A standard file-naming convention is useful for keeping track of image files. |
In addition, the database helps the staff at the USGS keep track of maps as they are searched for in the library. If a map is not found in the USGS library card catalog, or has been checked out, this information can be stored using the library table so its status is known.
Image Server
As mentioned previously, when most geologic maps are scanned full size at 300dpi they can be stored in a Tag Image File Format (TIFF) file that typically ranges from 250 ą 500 MB. By compressing these images into MrSID format, maps can be sized down to 15–25MB, but this is still much too large to be viewed over the Web. Even if the files were smaller, however, the MrSid is not a native browser format and a plug-in would be required to view the image online. In order to overcome these barriers, the Image Library employs the Lizardtech Express Server 4.0 which converts MrSID imagery in the Image Library to a browser friendly format.
The Express Server, installed directly on the Image Library Web server, makes it possible for users to view maps at full resolution in one of two ways (fig. 7). The first method uses an Extensible Stylesheet Language (XSL) formatted style sheet and server side processing to dynamically render the MrSid image as a Joint Photographic Experts Group (JPEG) file in the viewer’s browser window. The XSL stylesheet, which resembles a standard Web page in the user’s browser, is configured by LizardTech, Inc. to operate with the Express Server package. Its “look and feel”, however, is customized to the Image Library. Once rendered to a browser, the XSL stylesheet allows the user to zoom into and pan around the image to more clearly see the map and read the text. Each time the user changes their view of the map the image is redrawn. This method has proven to be quick and efficient in any browser with any connection speed.
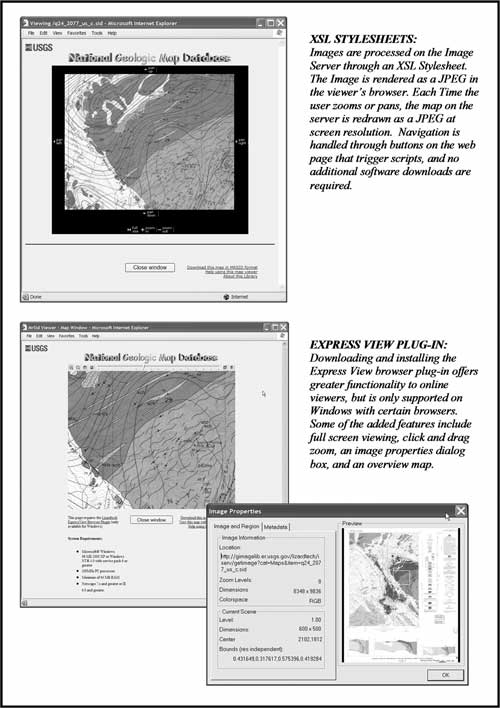 |
Figure 7. The LizardTech Express Server can deliver MrSID imagery online by using XSL stylesheets or requiring a client side browser plug-in. |
The second method, available only to clients with Windows 98/NT/2000/XP, requires a download and installation of the Lizardtech Express View Plug-In. This software package enables MrSid format to be displayed through a Web browser and comes with several additional tools that enhance the viewing experience. For example, users can view the maps “full screen” or zoom into a map by performing a click and drag of the mouse. While plug-in performance is excellent over a fast Web connection it performs poorly over dial-up and is only available to Windows users. For this reason the Express View plug-in is only incorporated into the Image Library as an additional feature.
Web Content Management and Application Development with Zope
The content stored in the Image Library consists of a map metadata MySQL database and a collection of raster images in MrSID format. In a Web application sense, the ultimate goal of the Image Library is to allow users to ask for a map online (a “request”), and receive the image and metadata from the database (a “response”). Often this Web / database interaction is handled by a server-side scripting language that processes the user input and generates dynamic Web output from the database. ASP, PHP, and JSP are just a few of the common server-side scripting languages found on the Web. Other available programs such as Zope and Cold Fusion have gone one step farther by allowing the Web application developer to manage all Web content, including the scripts that handle requests and responses, in single program environment. The Image Library uses such a program, Zope 2.6.1, to manage Web content and handle user / database interactions.
Zope is freely distributed by its designers, Digital Creations of Fredricksburg, MD (http://www.zope.org/). The application features a transactional object database capable of storing content, custom data, dynamic HTML templates, scripts, relational database connectivity information, and code. For example, Zope’s object database can hold an object named “sqlSelectMap”, which is Structured Query Language (SQL) code that selects a map in the Image Library database from two input values: the latitude and longitude. Once the SQL query (called a ZSQLMethod in Zope) is stored, it can be inserted into a Web page anywhere with simple code and used to pass the results of the query back to any user who enters a latitude and longitude. Zope retrieves the query results, re-writes the HTML code with the new results, and sends the new Web page to the user. In a similar manner, Zope can store images, image properties, page design templates, database connections, scripts, text objects, etc. in a single environment where they can be rapidly accessed by the Web developers.
An important feature of Zope is that the development environment is accessed through a standard Web browser. This “through the Web” development model means that work can take place online from any Web-enabled computer on the internal USGS network. This activity is protected by an integrated security system that uses password encryption and a hidden directory structure. Multiple designers and programmers can access Zope’s objects and make changes. Programmers can focus on bits of script and page functionality, while designers can edit the “look and feel” of the pages. In this sense, Zope allows the developers to separate “Web design” and “Web logic”.
Figure 8 shows a glimpse of the Zope development environment, know as the Zope Management Interface (ZMI), viewed with Windows Internet Explorer. Each of the Zope objects, including folders, images, SQL queries, scripts, and page templates, are stored in a hierarchical manner as Web page links. New objects can easily be added using a pull down menu in the upper right hand corner. Clicking on these links allows the user to edit, view, test, set properties, and establish security constraints for each object.
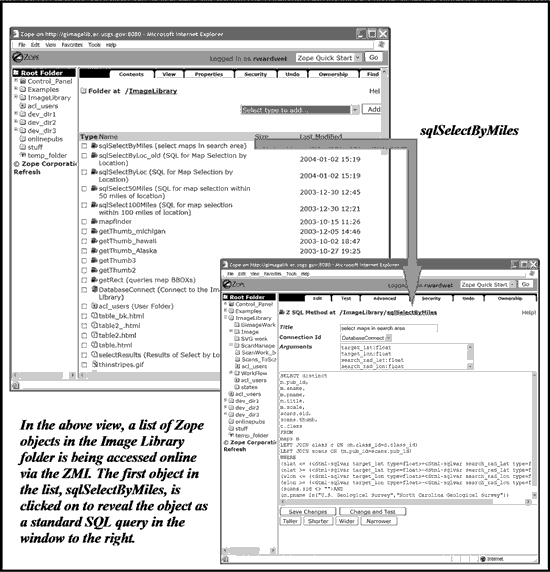 |
Figure 8. The Zope Management Interface seen through Internet Explorer. The ZMI allows developers to quickly access and implement Web content. |
Integrating the Zope objects together to build a finished Web application requires the use of two simple Zope scripting languages; Document Template Markup Language (DTML), and Template Attribute Language (TAL). Figure 9a illustrates how a developer might choose to manage Web content in Zope for a Website that allows online viewers to query a MySQL database. In this case the Zope objects are a database connection, a SQL query, an image with the NGMDB logo, and two HTML documents. Also included are two text objects labeled standard_html_header and standard_html_footer that hold the bits of HTML code required at the top and bottom of each page on the Website.
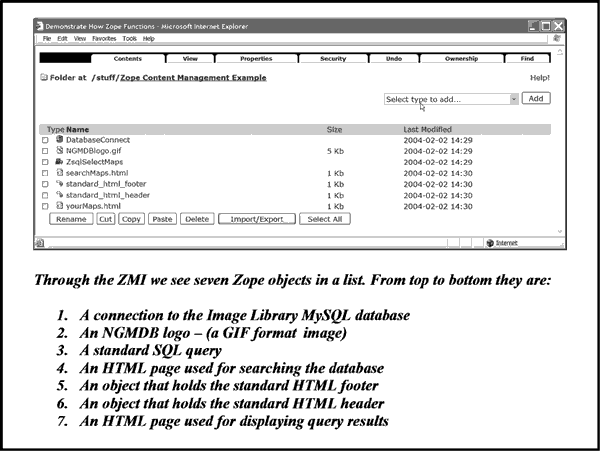 |
Figure 9a. An example of Web content storage in Zope. |
In figure 9b, we see how these objects fit together using bits of code written in Zope’s DTML language. The user is asked in searchMaps.html to enter a unique identifier, pub_id. This will return information about this publication from the database. When the user submits the entry, yourMaps.html is called. Within yourMaps.html, the SQL query ZsqlSelectMaps is run on the database, and the output results are written in standard HTML. Even though yourMaps.html only consists of several lines of DTML code in Zope it appears to the user as complete, standard, browser supported HTML code. When the next query is run, this HTML is modified by Zope and sent to the user once more. Also notice NGMDBlogo.gif appears automatically at the top of both pages because it is embedded in standard_html_header.
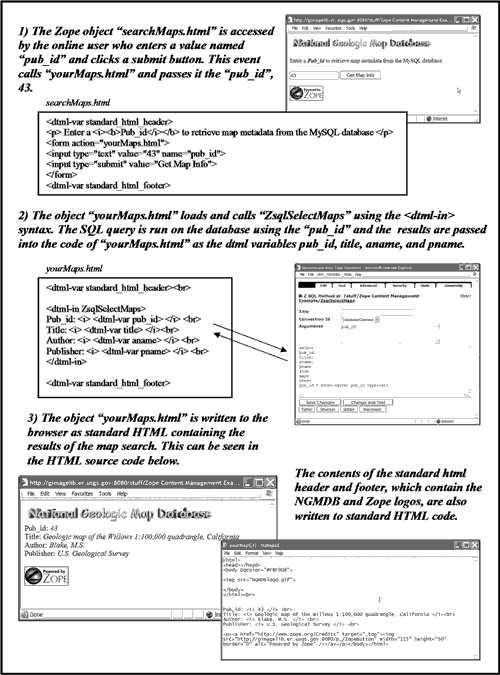 |
Figure 9b. Dynamic Web pages generated with Zope that are used to search the MySQL database and return results to the user. |
With its ability to manage client and database interactions through the use of stored objects, HTML input forms, and dynamically formatted HTML output, Zope has become a major component in the Image Library Web development. The Image Library staff also has implemented this technology to construct the fully Web-supported interface to the MySQL database shown in figure 10. This application is used to search the database for maps that have not been scanned, or to enter information about newly acquired imagery. It can be accessed from any location on the USGS internal network without the need for additional software.
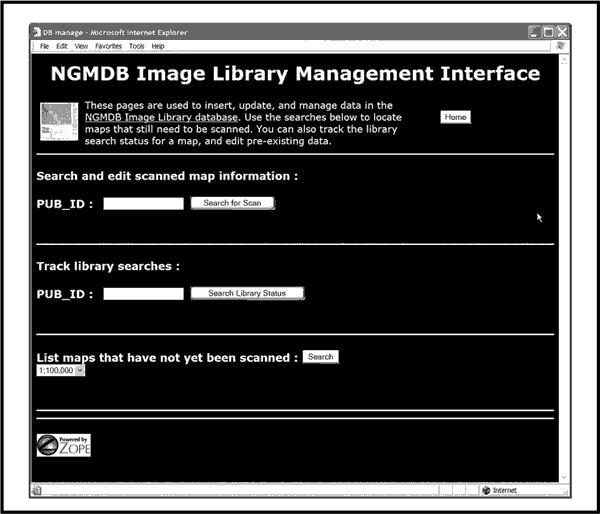 |
Figure 10. The MySQL database management application used by the USGS staff to retrieve and enter data. The application is created with Zope and is accessed online over the USGS intranet. |
One final item worth mentioning is that Zope includes its own relational database and Web server. For this project, however, Zope is configured with a more robust relational database, MySQL, and Apache Web Server supported by the LizardTech Image Server.
Online User Interface
The largest challenge of designing the Image Library has been developing an online user interface to meet the initial requirements of the project (fig. 1). The originally conceptualized interface (fig. 4) allows users to enter a Web GIS environment where they can see all available maps geo-referenced in their proper location. Adding multiple zoom levels allows users to get a closer look, and to eventually click on the geologic map they wish to see in detail. The imagery for the selected map, in MrSid format, is then loaded for online viewing. The main goal of this design is to allow for rapid access to scanned imagery by intuitive means.
While this design seems obtainable, and Web GIS applications are becoming more common all of the time, there are major obstacles in the development path. First, the Image Library eventually will host thousands of raster maps. The process of geo-referencing each map in the library adds a significant burden to the project workflow. Additionally, the process of loading, resizing, and rendering thousands of geo-referenced MrSid images into a Web GIS, such as ArcIMS, did not seem realistic. This operation is time and resource intensive even in most desktop GIS applications. Other methods, such as generating HTML image maps using ArcGIS extensions and Arc Macro Language (AML) scripts seem possible, but once again, this approach requires a great deal of human interaction and maintenance.
As the project developed, the staff turned towards the use of Scalable Vector Graphics (SVG) for a solution. SVG, an open source XML-derived graphics format recommended as a future World Wide Web consortium (W3c) standard, uses XML grammar to draw pictures. In other words, images are created as a tag based text file resembling XML or HTML. It is useful for creating scriptable, animated graphical Web interfaces that resembles those made with Macromedia Flash technology. Because SVG graphics are text generated, they can be altered to reflect the contents of a database, and can be scripted to take full advantage of the Document Object Model (DOM). This aids programming of Web objects in HTML and JavaScript. Figure 11 shows a snippet of SVG code that draws a colored rectangle. The JavaScript written into the SVG image produces an alert message when a mouse cursor rolls over the rectangle.
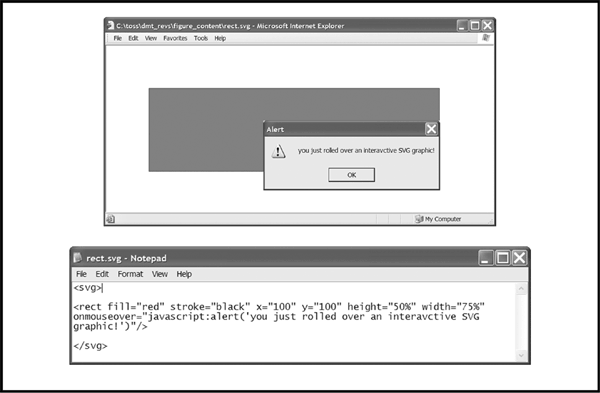 |
Figure 11. A simple SVG image. This text-generated graphic is internally coded with JavaScript and displays a message when a rollover event occurs. |
Raster images can be embedded and placed at any specified location in the SVG image and pixel coordinates can be transformed into real world latitude and longitude coordinates. With a freely available SVG plug-in (Adobe’s SVG viewer is available at http://www.adobe.com/svg/) this format can be viewed inside of a Web browser window. SVG plug-ins also include zoom and pan functionality. When a user zooms into an SVG image, it is redrawn to the appropriate resolution so that image quality is not degraded. Many online examples illustrate how effective SVG can be when used in cartographic applications on the Web (see http://www.svg.org/wiki/ow.asp?WebMappingExamples and http://www.carto.net/).
SVG is an excellent technology for the Image Library. The Library contains everything required to build an SVG file that takes each scanned image in the Library and draws it in geographic coordinate space, based on the latitude and longitude values stored in the database (see fig. 4). The process of writing an SVG Web map can be automated by formatting MySQL query output inside of the SVG text file.
The map shown in figure 12 is an SVG representation of the Image Library database. It possesses full zoom and pan functionality and links each map in the SVG file to its raster image in the Library. Our original base map, showing the conterminous U.S. and state boundaries, is derived from an ArcGIS shapefile and saved in SVG / text format with Adobe Illustrator 9.0. A shell script stored on the Image Library server runs daily to produce a JPEG thumbnail of each MrSid file in the Image Library. The LizardTech Express Server makes this possible. Each JPEG thumbnail, sized at 256 pixels in the largest dimension, can be appropriately resized and positioned in the SVG image based on the bounding coordinates for each map stored in the MySQL database.
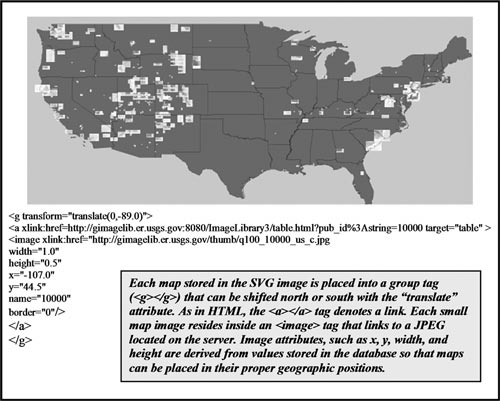 |
Figure 12. SVG is implemented to build a graphical representation of geologic maps available in the Image Library database. |
The code in figure 12 shows a section of the SVG source. The path for each map thumbnail is stored within an SVG image element using the xlink attribute. This tag points to the location of the thumbnail image on the Web server, and assigns a width, height, and location in SVG coordinate space. The SVG coordinate space is defined in the svg element (<svg></svg>) in the beginning of the file (not shown).
SVG seems like the perfect solution, but there is a significant problem common to many applications on the Web—not everyone uses the same browser. Internet Explorer, Netscape Navigator, Mozilla, Safari, Opera, and each of the other browsers and their many versions handle SVG content differently. Some do not yet handle the format at all, and the available plug-ins will not work in every browser. For this reason the Image Library Website has not fully implemented a SVG interface, but SVG is still an important part of the interface design.
As discussed, a SVG image representation of the database can be automatically generated through shell scripts and SQL queries stored on the server. This SVG image can, in turn, be captured as a JPEG that will load easily and quickly into a HTML page. When this technique is used at multiple SVG zoom levels, a collection of JPEG images is produced. Each JPEG snapshot of the SVG image represents a zoom level, and these images can be used efficiently in any browser setting to help users search for maps.
The process of automatically rendering a database-generated SVG as a collection of JPEG images relies on an open source product called the Batik SVG Toolkit. Batik (http://xml.apache.org/batik/) is developed under the Apache project by the same group that created the popular Apache Web Server. The Batik project has developed a group of Java modules that specifically deal with SVG. One of these modules, the SVG Rasterizer, allows for command line SVG to raster conversion with a variety of options.
The entire process can therefore be automated and set up to run at a specified time on the server. To create high-resolution, browseable JPEG images for the Image Library, a SVG of the conterminous U.S. is drawn from data in the database using shell scripts. The updated SVG image is opened with the Batik SVG Rasterizer and converted to a JPEG. To represent various zoom levels, the SVG is programmatically redrawn to a set of coordinates stored in an array and captured again as a JPEG by the Batik Rasterizer. Figure 13 provides a summary of how the Batik SVG Rasterizer is used to create browser supported JPEG versions of an SVG image at multiple zoom levels.
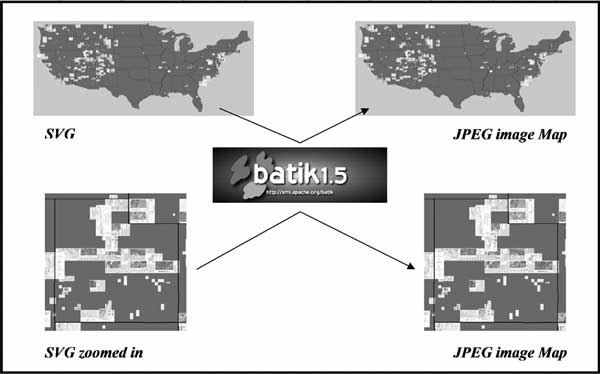 |
Figure 13. Using Batik to convert SVG files to JPEG format. When multiple zoom levels are processed, a collection of JPEG images is created. These images are used to build the Image Library cartographic search interface. |
Updated JPEG images are loaded onto the Image Library Web site as clickable image maps. This allows Web site viewers to specify an area on our searchable maps and retrieve a listing of available MrSID imagery from the database. Images at each zoom level are assigned a real world coordinate bounding box within a Javascript array. When a user clicks on the image map, the pixel coordinates are converted into the latitude and longitude coordinates used to search the database. SQL queries and page templates stored in Zope respond to the user’s query and refresh the Web page with new query results. A link is provided to route users into a window where they can view the entire geologic map in MrSID format via the LizardTech Express Server.
We plan several new features for the Image library that will be added incrementally. First, a browser-compatible SVG interface will be added as technology allows, giving online Web users the ability to zoom and pan the search maps at greater magnification levels. An SVG implementation will also permit us to add data layers such as roads, populated places, and hydrology to help users locate maps more effectively. Several browsers are moving towards supporting SVG natively, as the technology becomes more popular.
SUMMARY
The National Geologic Map Database project is archiving raster imagery of geologic maps in MrSID format and making them available to the public via an online Image Library. The Image Library delivers complete geologic map information to the user’s desktop where it is accessible as high resolution, lossless imagery. The main objective of the project is to encourage participation among USGS and state geological surveys. The initial Image Library Web release is scheduled for late 2003 or early 2004. In order to build a stable and robust system capable of future growth, the Image Library employs a MySQL database, a powerful Image Server from LizardTech, Inc. and Zope, a Web content management system. A Web site has been developed that allows users to see immediately on a national search map what maps are viewable, and to select the maps they wish to view by clicking on a location.
The Image Library is easy to use, and allows people to view geologic maps in great detail via the Internet. All USGS maps are available for free download. State geological surveys are encouraged to utilize the Image Library as a resource for their own maps, and have several options for participation (see companion paper in this volume).
This paper focuses on the technical details of how the Image Library Web application has been designed to increase efficiency and reduce the amount of human interaction and maintenance. From the beginning, our goal has been to move away from Web site development and into data acquisition and content. To support data acquisition, for example, we are working on a Web-based data submission form so that state geological surveys and participants within the USGS can submit images to the Image Library. The Image Library will then become a resource for organizations that wish to make their maps available via the Internet, but cannot justify the costs and labor associated with developing their own in-house systems.
REFERENCES
Cagle, Kurt, 2002, SVG Programming: The Graphical Web, Apress Publishing, p.1-20.
Cahill, C.R., Roberts, G.E., and Schug-O’Neill, Diane, 2002, Scanning and delivery of historic maps over the Web: The Library of Congress experience, in Soller, D.R., ed., Digital Mapping Techniques ’02—Workshop Proceedings: U.S. Geological Survey Open File Report 02-370, p. 106-111. http://pubs.usgs.gov/of/2002/of02-370/cahill.html.
Lattier, Amos and Pelletier, Michael, 2000, The Zope Book: New Riders Publishing, p. 1–8. http://www.zope.org/Documentation/Books/ZopeBook/.
Lizardtech, Inc., 2003, Lizard Tech Express Server 4.0 FAQ: Lizardtech, Inc. company Web site. http://www.lizardtech.com/support/faq/contentserver.php.
MySQL AB, 1997–2003, MySQL Reference Manual, MySQL AB, p.1–19. http://www.mysql.com/doc/en/index.html.
Soller, D.R. and Berg, T.M., 2002, The National Geologic Map Database: A progress report, in Soller, D.R., ed., Digital Mapping Techniques ’02—Workshop proceedings: U.S. Geological Survey Open File Report 02-370, p. 82–91, http://pubs.usgs.gov/of/2002/of02-370/soller2.html.