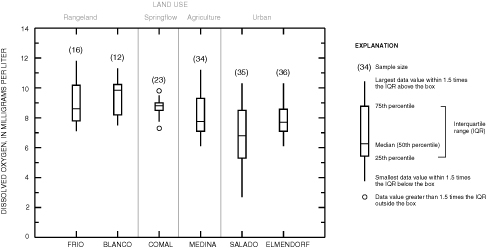
Figure 5. Distribution of monthly mean dissolved oxygen for all sites, January 1996–December 1998.
Contents | Back to Text | Figure 6