GEOLOGIC VARIABLES
The geomorphology variable expresses the relative erodibility of different landform types (Table 1). The geomorphology of the Olympic coast varies from sandy beaches (5 - very high vulnerability) to rocky cliffs (1 - very low vulnerability) (Figures 3 - 10). These data were derived primarily from the Washington Department of Ecology database of shoreline aerial photos (ECY, http://www.ecy.wa.gov/apps/shorephotos/index.html) and were supplemented with data from USGS 1:250,000-scale topographic maps, the Cascadia beach - shoreline database, Pacific Northwest region (Peterson and others, 1994), and with the book, The Pacific Northwest Coast:
Living with the shores of Oregon and Washington (Komar, 1997). In addition, field visits were made within the park to ground-truth the geomorphologic classification.
Historical shoreline change data for the ocean coast of Washington State were provided by the Coastal Monitoring and Analysis Program, Washington Department of Ecology, Olympia, Washington (R. C. Daniels, pers. comm., 2000).
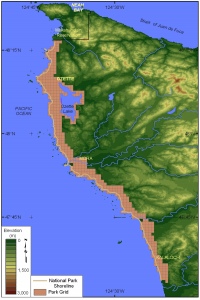 |
| Figure 2. Shoreline grid for Olympic National Park. Click on figure for larger image. |
These long-term annual erosion rates for the ocean coast are derived from NOS T-Sheets for the years 1926 - 30 and orthophotoquads for the years 1994 - 96; rates for the bays are derived from NOS T-Sheets from 1950 and orthophotoquads for the years 1994 - 96. Shoreline-change rate for the Olympic coast all fall within 1 meter of erosion or accretion for the 1 minute cells generated here.
The determination of regional coastal slope identifies the relative vulnerability of inundation and the potential rapidity of shoreline retreat because low-sloping coastal regions should retreat faster than steeper regions (Pilkey and Davis, 1987). The regional 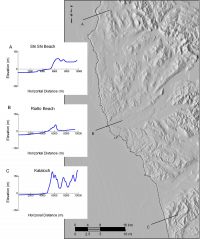 |
| Figure 11. Regional coastal slope cross-sections. Click on figure for larger image. |
slope of the coastal zone was calculated from a grid of topographic and bathymetric elevations extending landward
and seaward of the shoreline. For Olympic National Park, elevation data were obtained from the National Geophysical Data Center (NGDC) as gridded topographic and bathymetric elevations for 90-meter grid cells. Coastal slope was calculated for a 10-km (6.2 mile) radius (landward and seaward of the barrier) and then resampled to 1-minute resolution (Figure 2). The regional coastal slope for Olympic ranged from very high vulnerability (<4.55 %) to moderate vulnerability (7.75 - 10.85 %) (Figure 11 A - C).
Back to Top