

Map of Coastal
Vulnerability
 |
Discussion
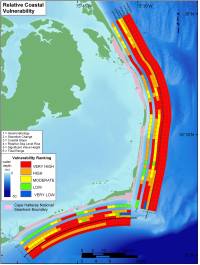 |
| Figure 13. Relative Coastal Vulnerability for Cape Hatteras National Seashore. Click on figure for larger image. |
The data within the CVI show variability at different spatial scales (Figure 13). However, the ranked values for the physical process variables vary little over the extent of the shoreline. The value of the relative sea-level rise variable is constant at very high vulnerability for the entire study area. The significant wave height vulnerability is very high to high, and the tidal range is very high vulnerability.
The geologic variables show greater variability and thus have the most influence on the CVI value and ranges (Figure 13). Geomorphology in the park includes high vulnerability barrier island shoreline with dune ridges separated by very high vulnerability washover-dominated low areas. 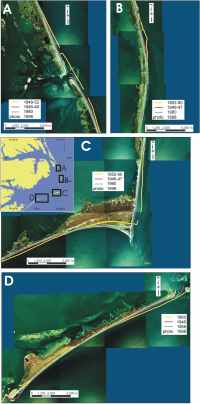 |
| Figure 12 A-D. Historic shoreline positions for A) Bodie Island and Pea Island NWR on either side of Oregon Inlet, B) Rodanthe, C) Cape Point, Buxton, Frisco, Hatteras Village, D) Ocracoke Island. Click on figure for larger image. |
Vulnerability assessment based on historical shoreline change trends varies from very low to very high (Figure 12 A -D). Regional coastal slope is mostly in the very high vulnerability range with a few high vulnerability slope areas.
The most influential variables in the CVI are geomorphology, shoreline change, regional coastal slope and significant wave height; therefore they may be considered the dominant factors controlling how Cape Hatteras will evolve as sea level rises. Geomorphology, coastal slope, and significant wave height only vary between high and very high vulnerability, whereas shoreline change ranges from very low to very high.
Because of the importance of habitat and the dynamic nature of the Outer Banks, concern about erosion, storm surge breaching of the barriers, future sea-level rise, and mainland flooding, planning is underway by private, federal, and state agencies to address these issues. Alternatives such as large-scale nourishment of the beach and dunes along Cape Hatteras are being considered. Implementation of future beach nourishment could alter the CVI results presented here.
Back to Top
|
|