Skip past header information USGS Logo with link to USGS Web page
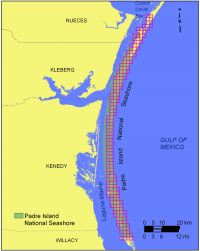
Coastal Vulnerability Assessment of Padre Island National Seashore to
Sea-Level Rise, USGS Open-File Report 2004-1090.

Map of Coastal Vulnerability

Skip past contents informationTable of Contents link to Title Page Link to Abstract Page Link to Introduction Page Link to Data Ranking Page Link to Padre Island National Seashore Page Link to Methology Page Link to Geologic Variables Page Link to Physical Process Variables Page Link to Calculating the Vulnerability Index Page Link to Results Page Link to Discussion Page Link to Conclusions Page Link to References Page

Methodology

In order to develop a database for a park-wide assessment of coastal vulnerability, data for each of the six variables mentioned above were gathered from state and federal agencies (Table 2). The database is based on that used by Thieler and Hammar-Klose (2000b) and loosely follows an earlier database developed by Gornitz and White (1992). A comparable assessment of the sensitivity of the Canadian coast to sea-level rise is presented by Shaw and others (1998).

Figure 2.  Shoreline grid for Padre Island National Seashore.
Figure 2. Shoreline grid for Padre Island National Seashore. Click on figure for larger image.
The database was constructed using a 1:70,000-scale shoreline for Padre Island that was produced from the medium resolution digital vector U.S. shoreline provided by the Strategic Environmental Assessments Division of NOAA's Office of Ocean Resources Conservation and Assessment (http://spo.nos.noaa.
gov/projects/shoreline/
shoreline.html). Data for each of the six variables (geomorphology, shoreline change, coastal slope, relative sea-level rise, significant wave height, and tidal range) were added to the shoreline attribute table using a 1-minute (approximately 1.5 km) grid (Figure 2). Next the data were assigned a relative vulnerability value from 1-5 (1 is very low vulnerability, 5 is very high vulnerability) based on the potential magnitude of its contribution to physical changes on the coast as sea level rises (Table 1).


Adobe Reader To view files in PDF format, download free copy of Adobe Reader.


Skip Footer Information [an error occurred while processing this directive]