GEOLOGIC VARIABLES
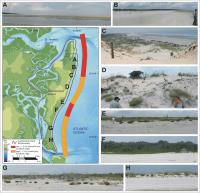 |
| Figure 3. The colorbar indicates geomorphology along the ocean shore of Cumberland Island National Seashore. Click on figure for larger image. |
The geomorphology variable expresses the relative erodibility of different landform types (Table 1). These data were derived from USGS 1-meter resolution digital orthophotos of Cumberland Island (Table 2). In addition, field visits were made within the park to ground-truth the geomorphologic classification. A USGS open-file report (Elko and others, 2002), and Living with the Georgia Shore (Clayton and others, 1992) were also used to help constrain the geomorphologic classification. Areas of Cumberland Island with a discontinuous foredune ridge less than 2 meters in height were classified as very high vulnerability, while areas with a continuous foredune ridge greater than 2 meters were classified as high vulnerability (Figure 3 A-H).
Shoreline erosion and accretion rates for Cumberland Island were calculated from data provided by the USGS National Assessment of Coastal Change Hazards project (Table 2). Shoreline rates of change (m/yr) were calculated at 200 m intervals (transects) along the coast using Digital Shoreline Analysis System (DSAS) software (http://woodshole.er.usgs.gov/project-pages/dsas/) to derive the rate of shoreline change. The change rates for each transect within a 1-minute grid cell were averaged to determine the shoreline change value used here, with positive numbers indicating accretion and negative numbers indicating erosion. Shoreline change rates on Cumberland Island range from greater than 2 m/yr of accretion (very low vulnerability) to almost 2 m/yr of erosion (high vulnerability) (Figure 4 A-E).
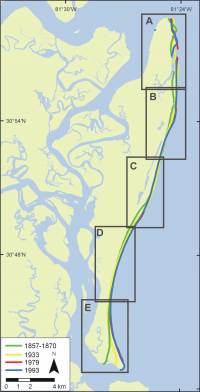 |
| Figure 4. Historic shoreline positions. Click on figure for larger image. |
The determination of regional coastal slope is an indication of the relative vulnerability to inundation and the potential rapidity of shoreline retreat because low-sloping coastal regions should retreat faster than steeper regions (Pilkey and Davis, 1987). The regional slope of the coastal zone was calculated from a grid of topographic and bathymetric elevations extending 10 km landward and seaward of the shoreline. Elevation data were obtained from the National Geophysical Data Center (NGDC) as gridded topographic and bathymetric elevations at 0.1 meter vertical resolution for 3 arc-second (~90 m) grid cells. Regional coastal slopes for Cumberland fall within the high vulnerability category (0.3 - 0.6 % slope).
Back to Top