Discussion
 |
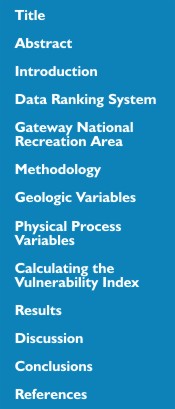
| Figure 7. Relative Coastal Vulnerability for Gateway National Recreation Area. Click on figure for larger image. |
The data within the CVI show variability at different spatial scales (Figure 7). The ranked values for the physical process variables generally vary less over the extent of the shoreline than the geologic variables. The value of the relative sea-level rise variable changes across the Hudson Shelf Valley from very high in NJ to moderate in NY. The significant wave height variable changes from very low to very high as a result of varying shoreline orientations, but the tidal range is ranked as very high vulnerability for all of Gateway.
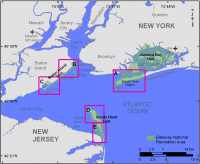 |
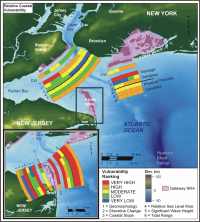
| Figure 6. Historic shoreline position index map. Click on figure for larger image. |
The geologic variables show higher resolution variability and thus have the most influence on the CVI value and ranges (Figure 7). Geomorphology in the park includes barrier spit shoreline and artificial fill ranked as very high vulnerability. Areas of glacial outwash were ranked as high vulnerability, and the terminal moraine near Ft. Wadsworth was ranked as moderate vulnerability. Vulnerability assessment based on historical shoreline change trends varies from very low to very high (Figure 6 A-E). Regional coastal slope varies from very low to high vulnerability.
The influential variables in the CVI are geomorphology, shoreline change, regional coastal slope, rate of sea-level rise, and significant wave height; therefore they may be considered the dominant factors controlling how Gateway will evolve as sea level rises. The sea level rise variable and wave height variable control regional differences in vulnerability, while the geologic variables resolve the coastal vulnerability within the park units.
Because of development and high economic value of property along the coast of Rockaway Beach and towns south of Sandy Hook such as Sea Bright, concern about erosion, storm-surge breaching of the barriers, future sea level rise, and mainland flooding, planning by Federal and State agencies may be required to address these issues. Alternatives such as large-scale nourishment of the beach and dunes along Rockaway Beach and Sea Bright could alter the CVI results presented here and mitigate sea-level rise effects.
Back to Top