U.S. Geological Survey

Whole rock geochemical data for altered and mineralized rocks, Red Dog Zn-Pb-Ag district, western Brooks Range, Alaska

Metadata also available as - [Outline] - [Parseable text] - [XML]

Frequently-anticipated questions:


What does this data set describe?

Title:
Whole rock geochemical data for altered and mineralized rocks, Red Dog Zn-Pb-Ag district, western Brooks Range, Alaska
Abstract:
This report presents geochemical analyses for 220 mostly altered and mineralized rock samples from the Red Dog Zn-Pb-Ag district in the western Brooks Range of northern Alaska. These data form the basis for a study by Slack et al. (2004a) on hydrothermal silicification and related alteration in wall rocks of the Red Dog deposits and the Anarraaq deposit 10 km to the northwest. The sulfide deposits occur within the Ikalukrok unit (informal name) of the Mississippian Kuna Formation (Moore and others, 1986). Principal rock types that were analyzed include black and gray shale, unmineralized bedded barite, mineralized (sulfide-rich) bedded barite, sulfide-rich silica rock (replaced barite), massive and semimassive sulfide, vein chalcedony, and Brookian (Cretaceous) vein quartz. For stratigraphic completeness, data are also reported here for a limited number of unaltered and unmineralized samples of black and gray shale, laminated carbonate-rich shale, lithic turbidite, bedded siliceous rock, calcareous radiolarite, and tectonic mélange. Detailed descriptions of the sampled sulfide deposits and their stratigraphic settings are given in Slack and others (2004a) and Kelley and others (2004a, b). The geochemical analyses are presented here in Microsoft Excel and .dbf spreadsheet formats in order to facilitate calculations and plotting of data. A related geochemical database on unaltered Paleozoic sedimentary rocks of the western Brooks Range is available in Slack and others (2004b).
Supplemental_Information:
Data for elements, oxides, and other components are presented either in weight percent or parts per million, except for Au that are in parts per billion. Qualified values (shown by the '<' symbol) represent values less than the specified minimum detection limit (MDL). In some cases, the MDL for a particular element or component is not uniform, which reflects changing analytical conditions or matrix effects, or use of newer ICP-MS instruments that have higher precision and lower MDLs. For statistical treatment of data and other calculations, it is recommended that qualified values be substituted by one-half the analytical detection limit (Sanford and others, 1993). Note that the abbreviation "n.a." refers to a lack of analysis for the specified element or component.

Values for the magnitude of the Ce and Eu anomalies are also presented. The magnitude of the Ce anomaly, Ce/Ce*, is calculated as: Ce[CN]/((La[CN])**0.667 * (Nd[CN])**0.333) where Ce[CN], La[CN], and Nd[CN] represent normalization of Ce, La, and Nd respectively to average chondrites using the data of Nakamura (1974). The magnitude of the Eu anomaly, Eu/Eu*, is calculated as: Eu[CN]/(Sm[CN]*Gd[CN])**0.5 with chondrite normalization of Eu, Sm, and Gd represented respectively as Eu[CN], Sm[CN], and Gd[CN]. In these formulae, two asterisks (**) are used to represent exponentiation; one alone indicates multiplication.
  1. How should this data set be cited?

    Slack, John F. , Kelley, Karen D. , and Clark, Jeffrey L. , 2004, Whole rock geochemical data for altered and mineralized rocks, Red Dog Zn-Pb-Ag district, western Brooks Range, Alaska: U.S. Geological Survey Open-File Report 2004-1372, U.S. Geological Survey, Reston, VA.

    Online Links:

  2. What geographic area does the data set cover?

    West_Bounding_Coordinate: -163.272222
    East_Bounding_Coordinate: -162.500000
    North_Bounding_Coordinate: 68.170621
    South_Bounding_Coordinate: 68.065714

  3. What does it look like?

    <http://pubs.usgs.gov/of/2004/1372/reddog.png> (PNG)
    Index map showing general location of the study area, 790x570 pixels, 53k bytes

  4. Does the data set describe conditions during a particular time period?

    Calendar_Date: 2004
    Currentness_Reference: publication date

  5. What is the general form of this data set?

    Geospatial_Data_Presentation_Form: table

  6. How does the data set represent geographic features?

    1. How are geographic features stored in the data set?

      This is a Point data set. It contains the following vector data types (SDTS terminology):

      • Entity point (220)

    2. What coordinate system is used to represent geographic features?

      Horizontal positions are specified in geographic coordinates, that is, latitude and longitude. Latitude and longitude values are specified in decimal degrees.

      The horizontal datum used is North American Datum of 1927.
      The ellipsoid used is Clarke 1866.
      The semi-major axis of the ellipsoid used is 6378206.4.
      The flattening of the ellipsoid used is 1/294.98.

  7. How does the data set describe geographic features?

    reddog.dbf
    Samples for which geochemical analyses have been conducted

    SAMPLE_NO
    Sample number

    Textual identifier without further scientific significance

    SAMPLE_DES
    Description of the sample

    Plain descriptive text

    SAMPLE_TYP
    Type of sampled material

    ValueDefinition
    Drill core 
    Open pit face 
    Outcrop 

    LOCATION
    Description of sampled location

    ValueDefinition
    Anarraaq zinc-lead deposit 
    Aqqaluk zinc-lead deposit 
    Gull Creek barite deposit 
    Husky Hills (E of Red Dog) 
    Main zinc-lead deposit 
    Paalaaq zinc-lead deposit 
    Red Dog Creek 
    Su barite deposit 
    Suds zinc-lead deposit 

    LATITUDE
    Latitude in decimal degrees

    Range of values
    Minimum:68.06571386760
    Maximum:68.17062130410

    LONGITUDE
    Longitude in decimal degrees

    Range of values
    Minimum:-163.2722220000
    Maximum:-162.5000000000

    STRATIGRAP
    Stratigraphic unit sampled

    ValueDefinition
    Ikalukrok unit of Kuna Formation 
    Kivalina unit of Kuna Formation 
    Lower Siksikpuk Formation 
    Melange unit of Kuna Formation 
    Noatak Sandstone 

    SIO2
    Silica as SiO2 in percent by weight

    Range of values
    Minimum:0.050
    Maximum:98.840

    TIO2
    Titanium Oxide in percent by weight

    Range of values
    Minimum:0.001
    Maximum:1.404

    AL2O3
    Aluminum oxide in percent by weight

    Range of values
    Minimum:0.0050
    Maximum:20.7400

    FE2O3
    Iron oxide in percent by weight (total iron reported as Fe2O3)

    Range of values
    Minimum:0.03
    Maximum:55.64
    Units:percent by weight

    MNO
    Manganese oxide in percent by weight

    Range of values
    Minimum:0.001
    Maximum:8.705
    Units:percent by weight

    MGO
    Magnesium oxide in percent by weight

    Range of values
    Minimum:0.01
    Maximum:12.96
    Units:percent by weight

    CAO
    Calcium oxide in percent by weight

    Range of values
    Minimum:0.01
    Maximum:43.78
    Units:percent by weight

    NA2O
    Sodium oxide in percent by weight

    Range of values
    Minimum:0.01
    Maximum:0.94
    Units:percent by weight

    K2O
    Potassium oxide in percent by weight

    Range of values
    Minimum:0.01
    Maximum:3.64
    Units:percent by weight

    P2O5
    Phosphate as P2O5 in percent by weight

    Range of values
    Minimum:0.01
    Maximum:6.11
    Units:percent by weight

    LOI
    Loss on ignition in percent by weight

    Range of values
    Minimum:0.7
    Maximum:36.84
    Units:percent by weight

    TOTAL
    Total of major element analysis, including LOI

    Range of values
    Minimum:1.15
    Maximum:101
    Units:percent by weight

    F
    Fluorine (F) in percent by weight

    ValueDefinition
    n.a. 

    Range of values
    Minimum:0.01
    Maximum:0.789
    Units:percent by weight

    TOTAL_C
    Total carbon in percent by weight

    ValueDefinition
    <0.01 

    Range of values
    Minimum:0.01
    Maximum:11.8
    Units:percent by weight

    CO2
    Carbon dioxide in percent by weight

    Range of values
    Minimum:0.4
    Maximum:37
    Units:percent by weight

    CORG
    Organic carbon in percent by weight

    Range of values
    Minimum:0.1
    Maximum:11.47
    Units:percent by weight

    S
    Sulfur (S) in percent by weight

    ValueDefinition
    n.a. 

    Range of values
    Minimum:0.1
    Maximum:39.3
    Units:percent by weight

    SO4
    Sulfate (SO4) in percent by weight

    ValueDefinition
    n.a. 

    Range of values
    Minimum:0.1
    Maximum:43.2
    Units:percent by weight

    RB
    Rubidium (Rb) in ppm (parts per million by weight)

    Range of values
    Minimum:1
    Maximum:188
    Units:ppm (parts per million by weight)

    CS
    Cesium (Cs) in ppm (parts per million by weight)

    Range of values
    Minimum:0.1
    Maximum:43.1
    Units:ppm (parts per million by weight)

    SR
    Strontium (Sr) in ppm (parts per million by weight)

    Range of values
    Minimum:4
    Maximum:3702
    Resolution:1

    BA
    Barium (Ba) in ppm (parts per million by weight)

    Range of values
    Minimum:42
    Maximum:581200
    Resolution:1

    Y
    Yttrium (Y) in ppm (parts per million by weight)

    Range of values
    Minimum:0.5
    Maximum:635.7
    Units:ppm (parts per million by weight)

    LA
    Lanthanum (La) in ppm (parts per million by weight)

    Range of values
    Minimum:0.2
    Maximum:170
    Units:ppm (parts per million by weight)

    CE
    Cerium (Ce) in ppm (parts per million by weight)

    Range of values
    Minimum:0.3
    Maximum:180.85
    Units:ppm (parts per million by weight)

    PR
    Praseodymium (Pr) in ppm (parts per million by weight)

    Range of values
    Minimum:0.01
    Maximum:33.43
    Units:ppm (parts per million by weight)

    ND
    Neodymium (Nd) in ppm (parts per million by weight)

    Range of values
    Minimum:0.03
    Maximum:165.23
    Units:ppm (parts per million by weight)

    SM
    Samarium (Sm) in ppm (parts per million by weight)

    Range of values
    Minimum:0.01
    Maximum:58.56
    Units:ppm (parts per million by weight)

    EU
    Europium (Eu) in ppm (parts per million by weight)

    ValueDefinition
    n.a. 

    Range of values
    Minimum:0.003
    Maximum:146.006
    Units:ppm (parts per million by weight)

    GD
    Gadolinium (Gd) in ppm (parts per million by weight)

    Range of values
    Minimum:0.01
    Maximum:91.78
    Units:ppm (parts per million by weight)

    TB
    Terbium (Tb) in ppm (parts per million by weight)

    Range of values
    Minimum:0.01
    Maximum:13.76
    Units:ppm (parts per million by weight)

    DY
    Dysprosium (Dy) in ppm (parts per million by weight)

    Range of values
    Minimum:0.01
    Maximum:92.72
    Units:ppm (parts per million by weight)

    HO
    Holmium (Ho) in ppm (parts per million by weight)

    Range of values
    Minimum:0.01
    Maximum:18.94
    Units:ppm (parts per million by weight)

    ER
    Erbium (Er) in ppm (parts per million by weight)

    Range of values
    Minimum:0.01
    Maximum:55.79
    Units:ppm (parts per million by weight)

    TM
    Thulium (Tm) in ppm (parts per million by weight)

    Range of values
    Minimum:0.01
    Maximum:6.045
    Units:ppm (parts per million by weight)

    YB
    Ytterbium (Yb) in ppm (parts per million by weight)

    Range of values
    Minimum:0.01
    Maximum:38.61
    Units:ppm (parts per million by weight)

    LU
    Lutetium (Lu) in ppm (parts per million by weight)

    Range of values
    Minimum:0.001
    Maximum:5.243
    Units:ppm (parts per million by weight)

    CE_CE
    Cerium anomaly (dimensionless). The magnitude of the Ce anomaly, Ce/Ce*, is calculated as: Ce[CN]/((La[CN])**0.667 * (Nd[CN])**0.333) where Ce[CN], La[CN], and Nd[CN] represent normalization of Ce, La, and Nd respectively to average chondrites using the data of Nakamura (1974). Here two asterisks (**) are used to represent exponentiation; one alone indicates multiplication.

    ValueDefinition
    n.a. 

    Range of values
    Minimum:0.43
    Maximum:1.1526
    Units:(ratio, no units)

    EU_EU
    Europium anomaly (dimensionless). The magnitude of the Eu anomaly, Eu/Eu*, is calculated as: Eu[CN]/(Sm[CN]*Gd[CN])**0.5 with chondrite normalization of Eu, Sm, and Gd represented respectively as Eu[CN], Sm[CN], and Gd[CN]. Here two asterisks (**) are used to represent exponentiation; one alone indicates multiplication.

    ValueDefinition
    n.a. 

    Range of values
    Minimum:0.482
    Maximum:19.9335
    Units:(ratio, no units)

    ZR
    Zirconium (Zr) in ppm (parts per million by weight)

    Range of values
    Minimum:1
    Maximum:264
    Units:ppm (parts per million by weight)

    HF
    Hafnium (Hf) in ppm (parts per million by weight)

    Range of values
    Minimum:0.1
    Maximum:5.3
    Units:ppm (parts per million by weight)

    NB
    Niobium (Nb) in ppm (parts per million by weight)

    Range of values
    Minimum:0.1
    Maximum:76.6
    Units:ppm (parts per million by weight)

    TA
    Tantalum (Ta) in ppm (parts per million by weight)

    Range of values
    Minimum:0.01
    Maximum:5.8
    Units:ppm (parts per million by weight)

    TH
    Thorium (Th) in ppm (parts per million by weight)

    Range of values
    Minimum:0.1
    Maximum:14.5
    Units:ppm (parts per million by weight)

    U
    Uranium (U) in ppm (parts per million by weight)

    Range of values
    Minimum:0.2
    Maximum:156
    Units:ppm (parts per million by weight)

    V
    Vanadium (V) in ppm (parts per million by weight)

    Range of values
    Minimum:5
    Maximum:880
    Units:ppm (parts per million by weight)

    SC
    Scandium (Sc) in ppm (parts per million by weight)

    Range of values
    Minimum:0.1
    Maximum:36
    Units:ppm (parts per million by weight)

    CR
    Chromium (Cr) in ppm (parts per million by weight)

    Range of values
    Minimum:9
    Maximum:1080
    Units:ppm (parts per million by weight)

    CO
    Cobalt (Co) in ppm (parts per million by weight)

    Range of values
    Minimum:1
    Maximum:145
    Units:ppm (parts per million by weight)

    NI
    Nickel (Ni) in ppm (parts per million by weight)

    Range of values
    Minimum:1
    Maximum:692
    Units:ppm (parts per million by weight)

    MO
    Molybdenum (Mo) in ppm (parts per million by weight)

    Range of values
    Minimum:0.5
    Maximum:209
    Units:ppm (parts per million by weight)

    CU
    Copper (Cu) in ppm (parts per million by weight)

    Range of values
    Minimum:9
    Maximum:484
    Units:ppm (parts per million by weight)

    ZN
    Zinc (Zn) in ppm (parts per million by weight)

    Range of values
    Minimum:29
    Maximum:464500
    Units:ppm (parts per million by weight)

    CD
    Cadmium (Cd) in ppm (parts per million by weight)

    ValueDefinition
    n.a. 

    Range of values
    Minimum:0.3
    Maximum:1050
    Units:ppm (parts per million by weight)

    PB
    Lead (Pb) in ppm (parts per million by weight)

    Range of values
    Minimum:5
    Maximum:163200
    Units:ppm (parts per million by weight)

    AG
    Silver (Ag) in ppm (parts per million by weight)

    Range of values
    Minimum:0.2
    Maximum:200
    Units:ppm (parts per million by weight)

    AU
    Gold (Au) in ppb (parts per billion by weight)

    ValueDefinition
    n.a. 

    Range of values
    Minimum:3
    Maximum:138
    Units:ppb (parts per billion by weight)

    GA
    Gallium (Ga) in ppm (parts per million by weight)

    Range of values
    Minimum:1
    Maximum:36
    Units:ppm (parts per million by weight)

    GE
    Germanium (Ge) in ppm (parts per million by weight)

    Range of values
    Minimum:0.5
    Maximum:822.7
    Units:ppm (parts per million by weight)

    TL
    Thallium (Tl) in ppm (parts per million by weight)

    Range of values
    Minimum:0.1
    Maximum:313
    Units:ppm (parts per million by weight)

    SB
    Antimony (Sb) in ppm (parts per million by weight)

    Range of values
    Minimum:0.1
    Maximum:919
    Units:ppm (parts per million by weight)

    AS
    Arsenic (As) in ppm (parts per million by weight)

    Range of values
    Minimum:0.3
    Maximum:672
    Units:ppm (parts per million by weight)

    BI
    Bismuth (Bi) in ppm (parts per million by weight)

    Range of values
    Minimum:0.1
    Maximum:4.3
    Units:ppm (parts per million by weight)

    SE
    Selenium (Se) in ppm (parts per million by weight)

    ValueDefinition
    n.a. 

    Range of values
    Minimum:3
    Maximum:135
    Units:ppm (parts per million by weight)

    SN
    Tin (Sn) in ppm (parts per million by weight)

    Range of values
    Minimum:1
    Maximum:36
    Units:ppm (parts per million by weight)

    W
    Tungsten (W) in ppm (parts per million by weight)

    Range of values
    Minimum:0.3
    Maximum:10.9
    Units:ppm (parts per million by weight)

    BE
    Beryllium (Be) in ppm (parts per million by weight)

    Range of values
    Minimum:1
    Maximum:7
    Units:ppm (parts per million by weight)


Who produced the data set?

  1. Who are the originators of the data set? (may include formal authors, digital compilers, and editors)

  2. Who also contributed to the data set?

  3. To whom should users address questions about the data?

    John F Slack
    USGS ER GD
    Mail Stop 954 USGS National Center
    12201 Sunrise Valley Drive
    Reston, VA 20192-0002
    USA

    703-648-6337 (voice)
    703-648-6383 (FAX)
    jfslack@usgs.gov


Why was the data set created?

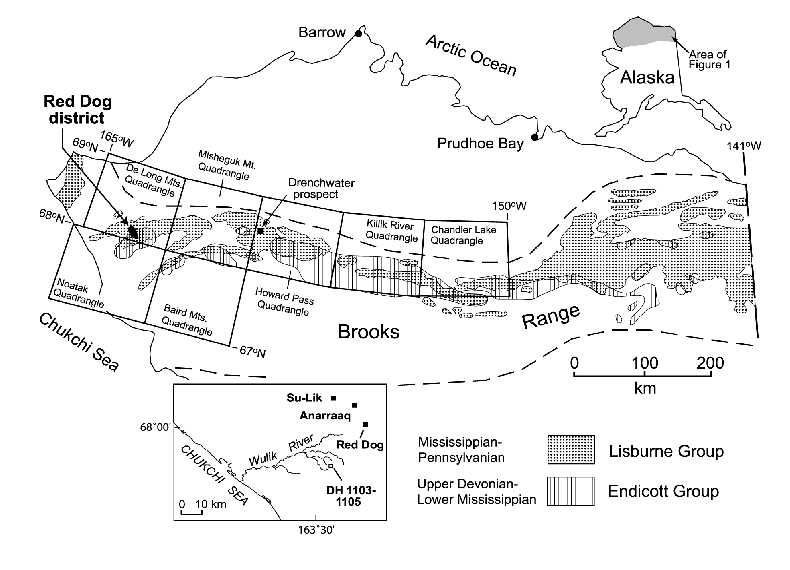
These data form the basis for a study by Slack and others (2004a) on hydrothermal silicification and related alteration in wall rocks of the Red Dog deposits and the Anarraaq deposit 10 km to the northwest.


How was the data set created?

  1. From what previous works were the data drawn?

  2. How were the data generated, processed, and modified?

    Date: 2004 (process 1 of 1)
    Geochemical analyses were obtained mostly on samples of diamond drill core 3.5 or 4.5 cm in diameter. Several analyzed samples come from mine faces within the Red Dog open pit (Main deposit) or from outcrops in the region. Samples were cut using water-cooled diamond saws in order to remove oxidized or weathered surfaces. Particular care was taken to cut out visible veins from altered wall rocks so that each analysis would represent a single rock type. Note, however, that disseminated and laminated sulfides (e.g., pyrite laminae in black shale) were retained in the samples prior to analysis. All samples were pulverized in an alumina ceramic mortar, which in some cases may have produced very minor contamination by trace amounts of Al, Ba, or rare earth elements (REE).

    Prior to analysis all samples were fused with lithium metaborate/ tetraborate to insure nearly complete acid digestion of resistate minerals such as zircon, monazite, rutile, chromite, and barite. All samples were analyzed by Activation Laboratories (ACT Labs) in Ancaster, Ontario, using methods described on their web site: <http://www.actlabs.com/>. Major elements, most trace elements, and REE were determined by inductively-coupled plasma mass spectrometry (ICP-MS), using an approach similar to that of Jenner and others (1990). REE in some barite samples were analyzed by high-resolution, magnetic sector ICP-MS using an ion exchange technique in order to eliminate Ba interference on Eu. Volatiles and related components (total C, CO2, Corg, S, SO4) were determined using conventional methods as described in Jackson and others (1987). Fluorine was analyzed by the ion selective electrode technique (Jackson and others, 1987). Data for Sc, Cr, Co, Au, Sb, As, and Se in most samples were obtained by instrumental neutron activation analysis (Hoffman, 1992), which provides more precise results than by ICP-MS. Au concentrations in most samples of semimassive and massive sulfide were also obtained by flame atomic absorption (Aruscavage and Crock, 1987) by XRAL Laboratories of Denver, CO, using on splits of the same rock powders that were earlier run for major and trace elements, and REE.

    Multiple standards were analyzed together with the submitted rock samples. Analyses by ACT Labs included data on 8 to 10 compositionally different standards with well-defined elemental concentrations. In addition to these standards, analyses were routinely obtained on duplicate samples and Ohio black shale SDO-1 (<http://minerals.cr.usgs.gov/geochem/ohioshale.html>). Precision and accuracy for concentrations 100x the minimum detection limit (MDL) was generally better than ±5 % relative, and in many cases such as for major elements was better than ±1 % relative. For concentrations approximately 10x the MDL, precision and accuracy were about ±10-20 % relative depending on the method used.

  3. What similar or related data should the user be aware of?

    Slack, John F. , Schmidt, J.M., and Dumoulin, J.A., 2004, Whole rock geochemical data for Paleozoic sedimentary rocks of the western Brooks Range, Alaska: U.S. Geological Survey Open-File Report 2004-1371, U.S. Geological Survey, Reston, VA.

    Online Links:


How reliable are the data; what problems remain in the data set?

  1. How well have the observations been checked?

    Precision and accuracy for concentrations 100x the minimum detection limit (MDL) was generally better than ±5 % relative, and in many cases such as for major elements was better than ±1 % relative. For concentrations approximately 10x the MDL, precision and accuracy were about ±10-20 % relative depending on the method used.

  2. How accurate are the geographic locations?

  3. How accurate are the heights or depths?

  4. Where are the gaps in the data? What is missing?

    Data are available for most elements in most samples. The code "n.a." is used to indicate an unavailable analysis; it occurs in only nine fields:

    Database
    Field                  Chemical
    Label     # missing    Species
    --------------------------------
     F           42        (F)
     S            5        (S)
     SO4          4        (sulfate)
     EU          12        (Eu)
     CE_CE        5        (Ce/Ce*)
     EU_EU       12        (Eu/Eu*)
     CD         151        (Cd)
     AU          43        (Au)
     SE          16        (Se)
    

  5. How consistent are the relationships among the observations, including topology?

    Multiple standards were analyzed together with the submitted rock samples. Analyses by ACT Labs included data on 8 to 10 compositionally different standards with well-defined elemental concentrations. In addition to these standards, analyses were routinely obtained on duplicate samples and Ohio black shale SDO-1 (<http://minerals.cr.usgs.gov/geochem/ohioshale.html>).


How can someone get a copy of the data set?

Are there legal restrictions on access or use of the data?

Access_Constraints: none
Use_Constraints: none

  1. Who distributes the data set? (Distributor 1 of 1)

    USGS Information Services
    Box 25286 Denver Federal Center
    Denver, CO 80225
    USA

    1-888-ASK-USGS (voice)
    303-202-4693 (FAX)
    ask@usgs.gov

  2. What's the catalog number I need to order this data set?

    USGS Open-File Report 2004-1372

  3. What legal disclaimers am I supposed to read?

    Although all data published in these grids have been used by the USGS, no warranty, expressed or implied, is made by the USGS as to the accuracy of the data and related materials. The act of distribution shall not constitute any such warranty, and no responsibility is assumed by the USGS in the use of these data or related materials.

    Any use of trade, product, or firm names is for descriptive purposes only and does not imply endorsement by the U.S. Government.

  4. How can I download or order the data?


Who wrote the metadata?

Dates:
Last modified: 21-Oct-2004
Metadata author:
Peter N. Schweitzer
Mail Stop 954 National Center
U.S. Geological Survey
12201 Sunrise Valley Drive
Reston, VA 20192
USA

(703) 648-6533 (voice)
(703) 648-6560 (FAX)
<pschweitzer@usgs.gov>

Metadata standard:
Content Standard for Digital Geospatial Metadata (FGDC-STD-001-1998)


Generated by mp version 2.8.17 on Thu Oct 21 15:37:59 2004