Methodology
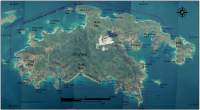 |
| Figure 2. Virgin Islands National Park on St. John Island. Click on figure for larger image. |
In order to develop a database for a park-wide assessment of coastal vulnerability, data for each of the six variables mentioned above were gathered from state and federal agencies (Table 2). The database is based on that used by Thieler and Hammar-Klose (1999) and loosely follows an earlier database developed by Gornitz and others (1994). A comparable assessment of the sensitivity of the Canadian coast to sea-level rise is presented by Shaw and others (1998).
The database was constructed using a 1:48,000-scale shoreline for Virgin Islands that was obtained from the National Oceanic and Atmospheric Administration's Biogeography Program (http://biogeo.nos.noaa.gov/products/benthic/). Data for each of the six variables (geomorphology, shoreline change, coastal slope, relative sea-level rise, significant wave height, and tidal range) were added to the shoreline attribute table using a 500-meter grid (Figure 3). For segments of shoreline
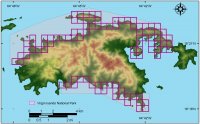 |
| Figure 3. Shoreline grid for Virgin Islands National Park.Click on figure for larger image. |
that experienced geomorphologic changes within one grid cell, smaller shoreline segments were created. Next each variable in each grid cell or shoreline segment was assigned a vulnerability value from 1-5 (1 is very low vulnerability, 5 is very high vulnerability) based on the potential magnitude of its contribution to physical changes on the coast as sea level rises (Table 1).