Methodology
In order to develop a database for a park-wide assessment of coastal vulnerability, data for each of the six variables mentioned above were gathered from state and federal agencies (Table 2). The database is based on that used by Thieler and Hammar-Klose (1999) and loosely follows an earlier database developed by Gornitz and White (1992). A comparable assessment of the sensitivity of the Canadian coast to sea-level rise is presented by Shaw and others (1998). Also a report on the effects of rising seas on coral reefs in South Florida was presented by Lidz and Shinn (1991).
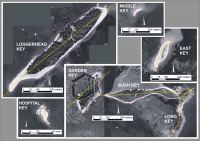 |
| Figure 2. Shoreline segments for the Dry Tortugas. Click on figure for larger image. |
The database was constructed using a 1:40,000-scale shoreline for Dry Tortugas that was produced by the Florida Department of Environmental Protection. Data for each of the six variables (geomorphology, shoreline change, coastal slope, relative sea-level rise, significant wave height, and tidal range) were added to the shoreline attribute table (Figure 2). Ideally, a 1-minute (approximately 1.5 km) grid is used to divide the shoreline into units in which each variable will be defined. However, due to the configuration and size of the islands of the Dry Tortugas, a grid was not feasible. All of the islands except middle key (the smallest) were divided into two shoreline segments generally along their long axis. Next each variable in each grid cell was assigned a vulnerability value from 1-5 (1 is very low vulnerability, 5 is very high vulnerability) based on the potential magnitude of its contribution to physical changes on the coast as sea level rises (Table1).