Results
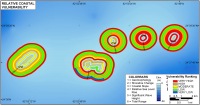 |
| Figure 5. Relative Coastal Vulnerability for Dry Tortugas National Park. Click on figure for larger image. |
The CVI values calculated for Dry Tortugas range from 8.16 to 18.26. The mean CVI value is 13.51; the mode is 11.55 and the median is 12.65. The standard deviation is 3.35. The 25th, 50th, and 75th percentiles are 9.0, 13.0 and 15.0, respectively.
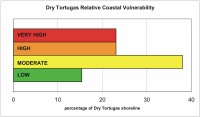 |
| Figure 6. Percentage of Dry Tortugas shoreline in each CVI category. Click on figure for larger image. |
Figure 5 shows a map of the coastal vulnerability index for Dry Tortugas National Park. The CVI scores are divided into low, moderate, high, and very high-vulnerability categories based on the quartile ranges and visual inspection of the data. CVI values below 9.0 are assigned to the low vulnerability category. Values from 9.0 to 13.0 are considered moderate vulnerability. High-vulnerability values lie between 13.1 and 15.0. CVI values above 15.0 are classified as very high vulnerability. Figure 6 shows the percentage of Dry Tortugas shoreline in each vulnerability category. Coastal Vulnerability was mapped for seven islands within the Dry Tortugas. Of this total, twenty-three percent of the mapped shoreline is classified as being at very high vulnerability due to future sea-level rise. Twenty-three percent is classified as high vulnerability, thirty-eight percent as moderate vulnerability, and sixteen percent as low vulnerability.