


U.S. Geological Survey Open File Report 2005-1038
Published 2005 - Online Only
Version
1.0 (En
español)
Prepared in cooperation with the Escuela Geología, Minas y Geofísica, Universidad Central de Venezuela
and the Fundación Venezolana de Investigaciones Sismológicas
Geologic Shaded Relief Map of Venezuela
By Paul C. Hackley,1 Franco Urbani,2 Alex W. Karlsen,1 and Christopher P. Garrity1
1U.S. Geological Survey, Reston, VA 20192.
2Escuela Geología, Minas y Geofísica,
Universidad
Central
de
Venezuela
and
Fundación Venezolana de Investigaciones Sismológicas, Caracas, Venezuela.
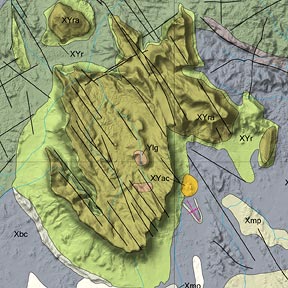 |
The geologic shaded relief map of Venezuela
was created by direct digitization of geologic and hydrologic data north
of the Orinoco River from a 1:500,000 scale paper map set. These data were
integrated with a digital geologic map of the Venezuela Guayana Shield,
also derived from 1:500,000 scale paper maps. Fault type information portrayed
on the map, including unlabeled fault types, are as depicted in the original
data sources. Geologic polygons were attributed for age, name, and lithologic
type following the Léxico Estratigráfico de Venezuela. Significant
revisions to the geology of the Cordillera de la Costa were incorporated
based on new, detailed (1:25,000 scale) geologic mapping. Geologic polygons
and fold and fault lines were draped over a shaded relief image produced
by processing 90 m (3-arc second) radar interferometric data obtained by
the space shuttle radar topography mission (SRTM). Values for null-data
areas inherent in the SRTM data set were filled by interpolation based on
surrounding data cells. The digital elevation model data was hill-shaded
using an illumination direction of 315 degrees at an angle of 65 degrees
above the horizon to produce the shaded relief image. The map projection
used is equidistant conic, with latitudes 4 and 9 degrees north as standard
parallels, and longitude 66 degrees west as the central meridian.
The data contained in this map compilation primarily
was derived from 1:500,000 scale maps and arranged for presentation and
use at the scale of 1:750,000. Users may zoom in to view greater detail
at larger scale; however, the authors make no guarantee of the accuracy
of the map representation at scales larger than 1:750,000.
|
| Nonsystematic
misregistration of some geologic contacts and faults with topographic lineaments
in the Guayana portion of the map becomes apparent with the drape of the
older geologic data over the newly-available SRTM dataset. The geologic
data of the Guayana area shown in this map was based on older imagery sources
which contained registration and splice errors. Correction of nonsystematic
misregistration errors is planned for future versions of the geologic map,
and map users are encouraged to contact the authors to report inaccuracies
(phackley@usgs.gov; urbani@cantv.net).
|
Data Available in this Report
This report is presented as Adobe Acrobat files. These files are large and therefore need to be saved to computer disk. For the PC, right-click and select "save target as"; for Macintosh, control-click and select "download link to disk."

- Sheet 1 (screen version)
[17.3-MB PDF file]
- Sheet 2 (screen version)
[11.9-MB PDF file]
- Sheet 1 (print version)
[182.7-MB PDF file]
- Sheet 2 (print version)
[120.9-MB PDF file]
Direct questions and comments to:
Paul C. Hackley
U.S. Geological Survey
Email to: phackley@usgs.gov
Phone (703)-648-6458
U.S. Department
of the Interior, U.S. Geological
Survey
URL: http://
pubsdata.usgs.gov
/pubs/of/2005/1038/index.html
Maintained by Eastern
Publications Group
Last modified:
21:11:01 Sat 12 Jan 2013
Privacy statement | General
disclaimer | Accessibility