
Coastal Vulnerability Assessment of Channel Islands National Park to Sea-Level Rise, USGS Open-File Report 2005-1057
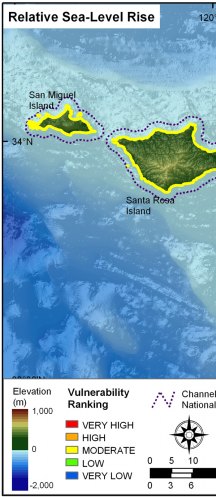
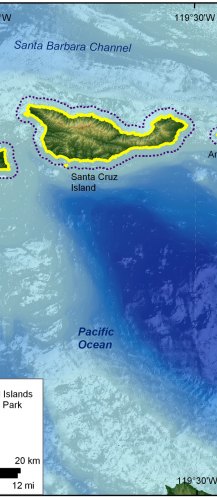
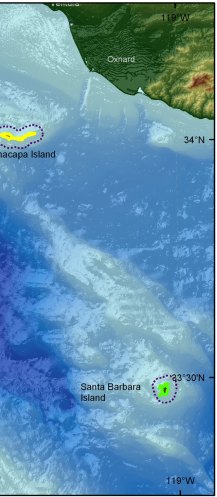
Figure 11. Rate of relative sea-level rise for Channel Islands National Park. The colored shoreline represents the ranked rate of rise for Santa Barbara and Newport Beach. All of northern Channel Islands are ranked as moderate vulnerability and Santa Barbara Island is ranked as low vulnerability with respect to sea-level rise. | ||
 |
 |
 |
