Geologic Variables
The geomorphology variable expresses the relative erodibility of different landform types (Table 1). These data were derived using 1-meter resolution 1994 digital orthophotos provided by the California Spatial Information Library (http://gis.ca.gov). In addition, a flight was chartered around the northern islands to obtain oblique aerial photos of the coast in order to verify the geomorphologic classification (Figures 4 - 8). The Channel Islands contained several geomorphology types, including low to very low vulnerability rock cliffs, moderate vulnerability alluvial deposits and beaches backed by cliffs, and high vulnerability gravel and sand beaches (Figure 3).
 |
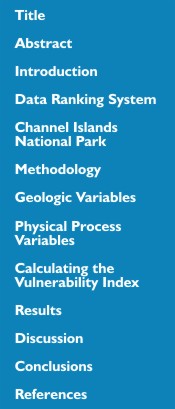
| Figure 9. Shoreline change for Channel Islands National Park. |
Shoreline erosion and accretion rates for Channel Islands National Park were estimated using digitized shorelines from 1948 U.S. Coast and Geodetic Survey Charts and 1994 aerial photography (Table 2). Shoreline rates of change (m/yr) were calculated at 200 m intervals (transects) along sandy beaches of San Miguel Island using Digital Shoreline Analysis System (DSAS) software (http://woodshole.er.usgs.gov/project-pages/dsas/) to derive the rate of shoreline change. Shoreline change rates on San Miguel all fell within the moderate vulnerability category, which is between -1 m/yr and +1 m/yr. Rates of shoreline change are expected to be the highest on San Miguel because it has the most erodible coastline and is exposed to the highest wave energy of all the Channel Islands. Most of the shoreline of the Channel Islands has not changed significantly since 1948 because the coast is largely consolidated and rocky; however, there was a major landslide on Santa Cruz in the 1990's that resulted in accretion of the shoreline (Figure 5E). Shoreline erosion and accretion rates in sandy areas on islands other than San Miguel were expected to fall with -1 and +1 m/yr or within the measurement error for an endpoint shoreline change calculation (Figure 9).
 |
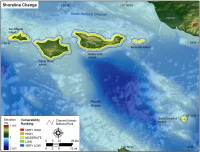
| Figure 10. Regional coastal slope for Channel Islands National Park. |
Regional coastal slope is an indication of the relative vulnerability to inundation and the potential rapidity of shoreline retreat because low-sloping coastal regions should retreat faster than steeper regions (Pilkey and Davis, 1987). The regional slope of the coastal zone was calculated from a grid of topographic and bathymetric elevations extending 5 km landward and seaward of the shoreline. Elevation data were obtained from the National Geophysical Data Center (NGDC) as gridded topographic and bathymetric elevations at 0.1-meter vertical resolution for 90-meter grid cells (Table 2). Regional coastal slopes for the Channel Islands fall within the very low to very high vulnerability category (< 4.55% - > 14.7%) (Figure 10).
Back to Top