Results
The CVI values calculated for Point Reyes range from 4.24 to 24.49. The mean CVI value is 10.49; the mode is 6.00 and the median is 8.49. The standard deviation is 6.06. The 25th, 50th, and 75th percentiles are 6.0, 9.0 and 11.0, respectively.
Figure 11 shows a map of the coastal vulnerability index for Point Reyes National Seashore. The CVI scores are divided into low, moderate, high, and very high-vulnerability categories based on the quartile ranges and visual inspection of the data. CVI values below 6.0 are assigned to the low vulnerability category. Values from 6.0 to 9.0 are considered moderate vulnerability. High-vulnerability values lie between 9.01 and 11.0. CVI values above 11.0 are classified as very high vulnerability. Figure 12 shows the percentage of Point Reyes shoreline in each vulnerability category. Over 90 km (50 miles) of shoreline is evaluated along the national seashore. Of this total, twenty-four percent of the mapped shoreline is classified as being at very high vulnerability due to future sea-level rise. Twenty-six percent is classified as high vulnerability, twenty-six percent as moderate vulnerability, and twenty-four percent as low vulnerability.
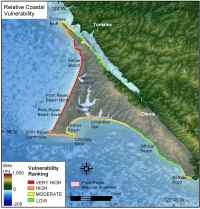
Figure 11. Relative Coastal Vulnerability for Point Reyes National Seashore. Click on figure for larger image. |
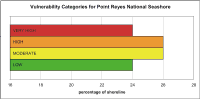 Figure 12. Percentage of Point Reyes shoreline in each CVI category. Click on figure for larger image. Figure 12. Percentage of Point Reyes shoreline in each CVI category. Click on figure for larger image. |