
This report is preliminary and has not been reviewed for conformity with the U.S. Geological Survey editorial standards or with the North American Stratigraphic Code. Any use of trade, firm, or product names is for descriptive purposes only and does not imply endorsement by the U.S. Government.
US Geological Survey, 345 Middlefield Road, MS 977, Menlo Park, CA 94025
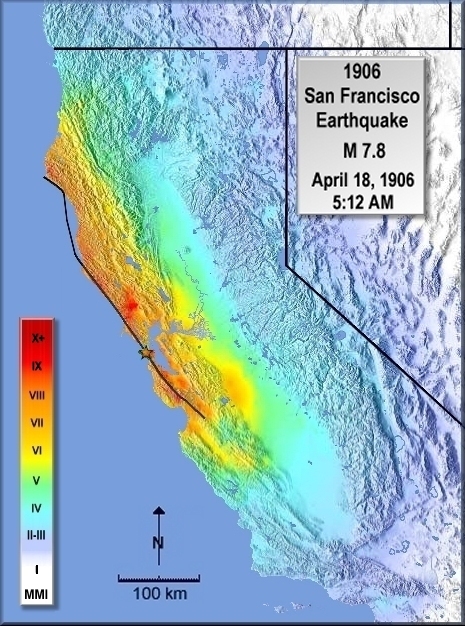 This website presents Modified Mercalli Intensity maps for the great San Francisco earthquake of April 18, 1906. These new maps combine two important developments. First, we have re-evaluated and relocated the damage and shaking reports compiled by Lawson (1908). These reports yield intensity estimates for more than 600 sites and constitute the largest set of intensities ever compiled for a single earthquake. Second, we use the recent ShakeMap methodology to map these intensities. The resulting MMI intensity maps are remarkably detailed and eloquently depict the enormous power and damage potential of this great earthquake.
Interpolated MMI intensity maps for the M = 7.8 San Francisco earthquake that can be compared with Stover and Coffman's (1993) contoured MMI intensity map and with the interpolated intensity map for the M = 6.9 Loma Prieta earthquake.
The 1906 earthquake was so large that the shaking effects do not fit Richter's (1958) Modified Mercalli Intensity scale. We enumerate the characteristic effects observed in the 1906 earthquake and discuss how the MMI intensity scale was revised for this earthquake.
The California Earthquake Commission received reports from many towns and rural post offices that have since disappeared, been renamed, or been inundated by reservoirs. We compile the geographic and geologic information for all the sites, as well as an extensive set of notes that describe locating and assigning intensities at the most important sites.
Explanation of the mechanics of plotting MMI intensity maps in ShakeMap format, and how the 1906 intensities attenuate with distance from the fault.
For questions about the content of this report, contact Jack Boatwright.
| Help
| PDF help
| Publications main page | Open-File
Reports for 2005 |