USGS Open-File Report 2005-1231
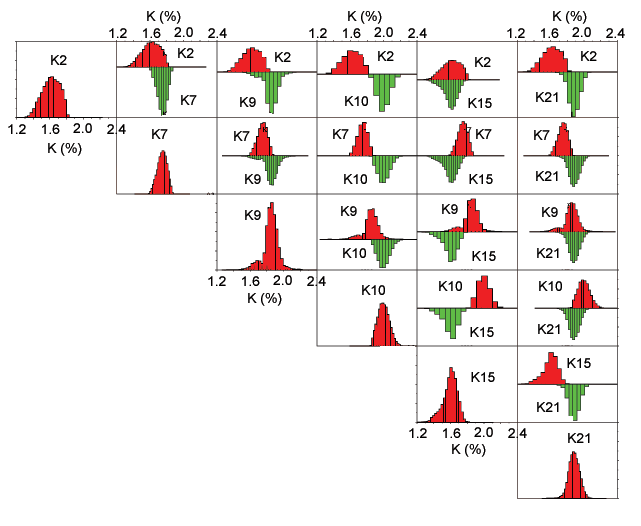
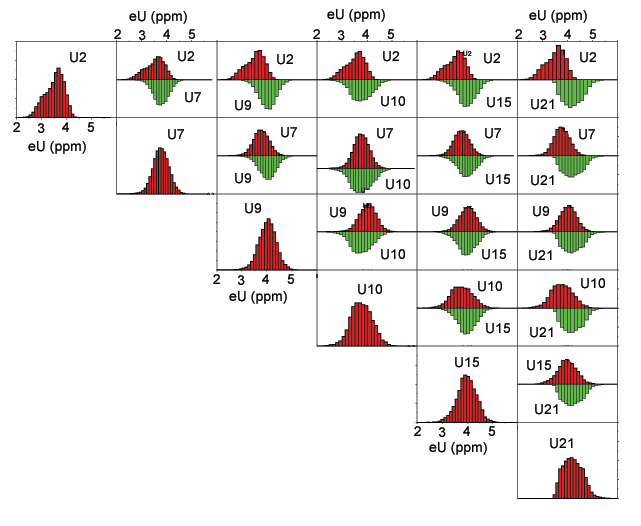
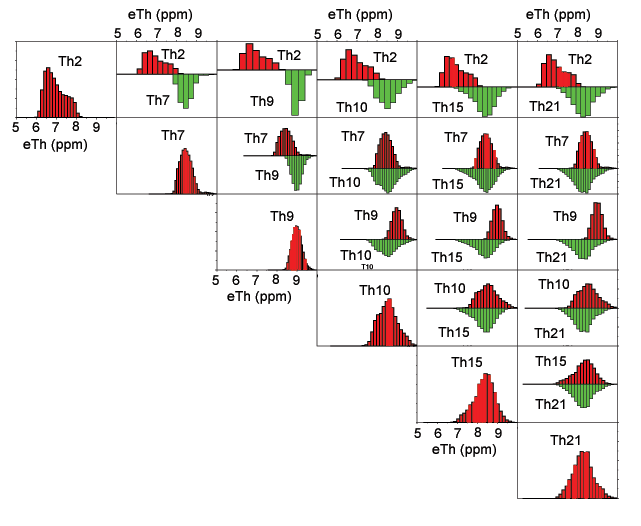
The recent floodplain deposits are mostly associated with classes R02, R07, R09, R10, R15, and R21. Figure 1 shows a matrix of histograms comparing the potassium distributions of the classes. Figure 2 shows a matrix of histograms comparing the uranium distributions. Figure 3 shows a matrix of histograms comparing the thorium distributions.
Class R02 has consistently lower concentrations of thorium than the other classes in this group. Class R02 potassium concentrations are also lower except for class R15 which has similar potassium distribution. The average uranium value for class R02 is lower than the average uranium values for the other classes although the uranium distributions do overlap for more than half of the data for each class. The generally lower concentrations of potassium, uranium, and thorium may indicate greater amounts of water compared to the other classes.
Class R07 has lower potassium concentrations than classes R09, R10, and R21 and somewhat higher concentrations than classes R02 and R15. The uranium distribution of R07 is similar to the uranium distributions of the other classes in this group. R07 has somewhat lower concentrations of thorium than R09 and higher concentrations than R02. The thorium distribution of R07 is similar to those of classes R10, R15, and R21.
Class R09 has generally higher potassium concentrations than classes R02, R07, and R15, somewhat lower concentrations than R10, and a similar distribution to that of R21. The uranium distribution of R09 is similar to the uranium distributions of classes R07, R09, R15, and R21 and R09 has somewhat higher concentrations of uranium than R02.
Class R10 has higher potassium concentrations than the other classes in this group. The uranium distribution of R10 is similar to the uranium distributions of the other classes in this group. Class R10 has higher thorium concentrations than R02 and somewhat lower concentrations than R09. The R10 thorium distribution is similar to the thorium distributions of classes R07, R15, and R21.
Class R15 has lower potassium concentrations than classes R07, R09, R10, and R21 and its potassium distribution is similar to that of class R02. The uranium distribution of R15 is similar to the uranium distributions of the other classes in this group. Class R15 has higher thorium concentrations than R02 and somewhat lower concentrations than R09. The R15 thorium distribution is similar to the thorium distributions of classes R07, R10, and R21.
Class R21 has higher potassium concentrations than classes R02, R07, and R15, somewhat lower concentrations than R10, and a potassium distribution similar to that of R09. The uranium distribution of R21 is similar to the uranium distributions of the other classes in this group. The thorium concentrations of class R21 are generally higher than the concentrations of classes R09 and R02. The thorium distribution of R21 is similar to the thorium distributions of classes R07, R10, and R15.
Figure 1. Matrix of histograms comparing the potassium distributions of classes R02, R07, R09, R10, R15, and R21. The horizontal scales are identical for all of the graphs but the vertical scales vary. The vertical axis shows the frequency of ranges of potassium concentrations. The bin sizes used to calculated the histograms also vary.

Figure 2. Matrix of histograms comparing the uranium distributions of classes R02, R07, R09, R10, R15, and R21. The horizontal scales are identical for all of the graphs but the vertical scales vary. The vertical axis shows the frequency of ranges of uranium concentrations. The bin sizes used to calculated the histograms also vary.

Figure 3. Matrix of histograms comparing the thorium distributions of classes R02, R07, R09, R10, R15, and R21. The horizontal scales are identical for all of the graphs but the vertical scales vary. The vertical axis shows the frequency of ranges of thorium concentrations. The bin sizes used to calculated the histograms also vary.
