USGS Open-File Report 2005-1231
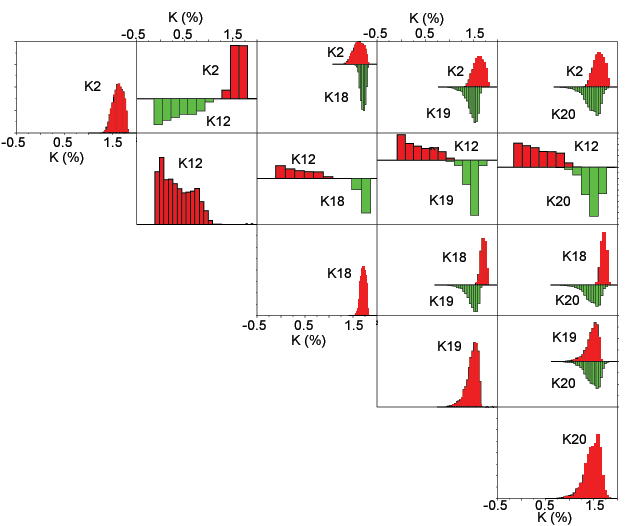
The histograms presented as bi-histograms are essentially identical to those presented as part of the statistical graphs. Bi-histograms present the histograms in pairs with one histogram plotted above the x-axis and the other below the axis. This type of graph allows you to clearly see whether the histograms have significant overlap. To facilitate comparison of multiple histograms, bi-histograms of classes interpreted to be related are plotted in a matrix format. The rows and columns of a matrix correspond to the classes. The graphs along the diagonal of the matrix show the histogram for a particular class and the off diagonal graphs are bi-histograms. In the bi-histogram graphs, the histogram plotted above the x-axis (colored red) is that of the class that identifies the row of the matrix. The histogram plotted below the x-axis (colored green) is that of the class that identifies the column of the matrix. The scales and bin sizes for the histograms are optimized for each pair of classes and vary among the graphs. For clarity the data for the potassium, uranium, and thorium are plotted in separate matrices of bi-histograms.
If the histograms for two classes are similar for all three elements, the interpretation is that those classes are not really distinct and consideration should be given to combining the classes. Additional attention needs to be paid to the geographical relationship of the two classes. If two classes are mostly spatially adjacent and the histograms are similar, those two classes are likely to be representative of the same geologic unit.
Figure I1 shows a matrix of potassium histograms for classes that appear to be related to the presence of water. Class R12 is most clearly related to bodies or water (see the classification map). The other classes often occur as narrow bands around class R12. In this matrix of bi-histograms, the potassium data for class R02 overlap the distributions for classes R18, R19, and R20. The potassium distributions for classes R19 and R20 are very similar although class R18 does not overlap much with classes R19 and R20. One needs to examine the distributions for uranium and thorium also. If the distributions show a lot of overlap, the soils are likely to be very similar.

Figure I1. Matrix plot of potassium histograms for classes interpreted as reflecting the presence of water.
Classes Related to Goliad Formation
Classes Related to Lissie Formation
Classes Related to Beaumont Formation
Classes Related to Rio Grande Floodplain Deposits
Classes Associated with Recent Floodplain Deposits
![]() Interpret Statistical Graphs | Data
Interpret Statistical Graphs | Data ![]()