Results
The CVI values calculated for Kaloko-Honokohau range from 7.91 to 15.81. The mean CVI value is 12.34; the mode and the median are 12.25. The standard deviation is 2.41. The 25th, 50th, and 75th percentiles are 11.0, 13.0 and 15.0, respectively.
Figure 10 shows a map of the coastal vulnerability index for Kaloko-Honokohau National Historical Park. The CVI scores are divided into low, moderate, high, and very high-vulnerability categories based on the quartile ranges and visual inspection of the data. CVI values below 11.0 are assigned to the low vulnerability category. Values from 11.0 to 13.0 are considered moderate vulnerability. High-vulnerability values lie between 13.1 and 15.0. CVI values above 15.0 are classified as very high vulnerability. Figure 11 shows the percentage of Kaloko-Honokohau NHP shoreline in each
vulnerability category. Eight kilometers of shoreline along Kaloko-Honokohau NHP were evaluated in this assessment. Of this, nineteen percent of the mapped shoreline is classified as being at very high vulnerability due to future sea-level rise. Twenty-five percent is classified as high vulnerability, thirty-one percent as moderate vulnerability, and twenty-five percent as low vulnerability. The methodology for CVI analysis is best suited for parks with larger shoreline extents and greater geologic and physical process variability than Kaloko-Honokohau NHP. Results presented here should be used in conjunction with higher resolution studies for park management planning.
|
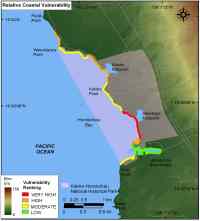 |
| Figure 10. Relative Coastal Vulnerability for Kaloko-Honokohau National Historical Park. |
|
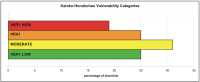 |
Figure 11. Percentage of Kaloko-Honokohau shoreline in each CVI category. Click on figure for larger image.
|
|
|