

Maps of Coastal
Change-Potential: Apostle Islands NL, Indiana Dunes NL, Sleeping Bear Dunes NL,
 |
Discussion
Apostle Islands National Lakeshore
The data within the coastal change-potential index (CPI) show variability at different spatial scales within Apostle Islands NL. Variables such as lake-level change (low change potential) and annual ice cover (moderate change potential) are constant within the park (Figure 9A and Figure 12A). The variable for shoreline change is primarily low with a few areas of moderate to high values due to higher shoreline-erosion rates (Figure 7A). The significant wave height variable is high to very low, because the archipelago has many shoreline orientations. Shoreline segments vary from, exposed to direct wave energy, to completely sheltered from waves (Figure 10A). Geomorphology and regional coastal slope vary from low to very high and very low to very high, respectively. Lakeshore geomorphology within Apostle Islands NL includes exposed bedrock, reworked glacial bluffs, gravel and sand beaches and spits (Figure 6A). Coastal slope is most closely related to the proximity to Bayfield Peninsula and Lake Superior water depth for Apostle Islands NL (Figure 8A). The most influential variables in the CPI assessment for Apostle Islands NL are geomorphology, coastal slope, and significant wave height; therefore they are considered the dominant factors controlling how Apostle Islands NL, will evolve as future lake levels change (Figure 13A).
|
Figure 6A. Click on figure for larger image.
|
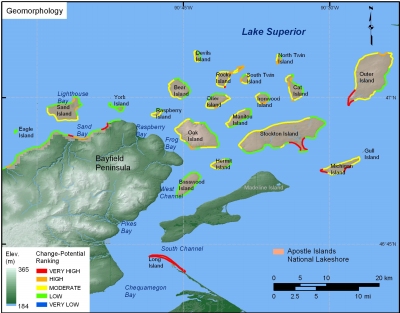 |
Figure 6A. Lakeshore geomorphology for Apostle Islands National Lakeshore.
Figure 7A. Shoreline change for Apostle Islands National Lakeshore.
Figure 8A. Regional coastal slope for Apostle Islands National Lakeshore.
Figure 9A. Rate of relative lake-level change for Apostle Islands National Park.
Figure 10A. Mean significant wave heights for Apostle Islands National Lakeshore.
Figure 12A. Mean Annual Ice Cover for Apostle Islands National Lakeshore.
Figure 13A. Relative Coastal Change-potential for Apostle Islands National Lakeshore.
|
|
Back to Top
Indiana Dunes National Lakeshore
The data within the coastal change-potential index (CPI) show variability at different spatial scales for Indiana Dunes NL. Variables such as regional coastal slope (very high), lake-level change (moderate), and mean annual ice cover (high) are constant within the park (Figure 8B, Figure 9B, and Figure 12B). The variable for shoreline change is low to high as determined from historic shoreline recession rates (Stewart, 1994) (Figure 7B). The significant wave height variable is high for all of Indiana Dunes NL (Figure 10B). Lakeshore geomorphology within Indiana Dunes is primarily sand beaches backed by dunes (very high) with bluff areas classified from moderate (< 15 m in height) to low (> 15 m in height) change potential (Figure 6B). The most influential variables in the CPI assessment for Indiana Dunes NL are geomorphology, coastal slope, and shoreline erosion/accretion rate; therefore they are considered the dominant factors controlling how Indiana Dunes NL, will evolve as future lake levels change (Figure 13B).
|
Figure 6B. Click on figure for larger image.
|
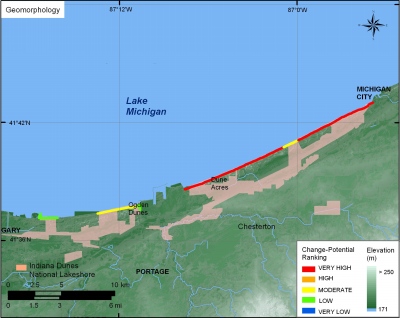 |
Figure 6B. Lakeshore geomorphology for Indiana Dunes National Lakeshore.
Figure 7B. Shoreline change for Indiana Dunes National Lakeshore.
Figure 8B. Regional coastal slope for Indiana Dunes National Lakeshore.
Figure 9B. Rate of relative lake-level change for Indiana Dunes National Park.
Figure 10B. Mean significant wave heights for Indiana Dunes National Lakeshore.
Figure 12B. Mean Annual Ice Cover for Indiana Dunes National Lakeshore.
Figure 13B. Relative Coastal Change-potential for Indiana Dunes National Lakeshore.
|
Back to Top
Sleeping Bear Dunes National Lakeshore
The data within the coastal change-potential index (CPI) show variability at different spatial scales for Sleeping Bear Dunes NL. Variables, such as lake-level change (moderate) and mean annual ice cover (high), are constant within the park (Figure 9C and Figure 12C). The variable for shoreline erosion/accretion rate is primarily low as determined from historic shoreline recession data (Stewart, 1994) with an area of high change-potential where three major landslides occurred this century (Figure 7C). The significant wave height variable is high to very high for most of Sleeping Bear Dunes NL, but sheltered areas on the Manitou Islands are low change potential (Figure 10C). Lakeshore geomorphology within Sleeping Bear Dunes is primarily sand beaches backed by dunes (very high change potential) with areas of exposed glacial bluff (moderate change potential), and sand and gravel areas (high change potential) (Figure 6C). The most influential variables in the CPI assessment for Sleeping Bear Dunes NL are geomorphology, coastal slope, and significant wave heights; therefore they are considered the dominant factors controlling how Sleeping Bear Dunes NL, will evolve as future lake levels change (Figure 13C).
|
Figure 6C. Click on figure for larger image.
|
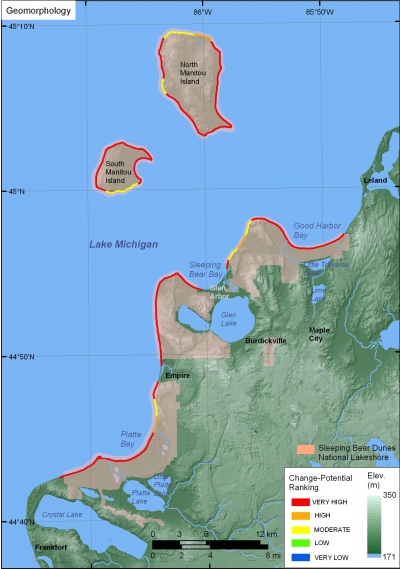 |
Figure 6C. Lakeshore geomorphology for Apostle Islands National Lakeshore.
Figure 7C. Shoreline change for Sleeping Bear Dunes National Lakeshore.
Figure 8C. Regional coastal slope for Sleeping Bear Dunes National Lakeshore.
Figure 9C. Rate of relative lake-level change for Sleeping Bear Dunes National Park.
Figure 10C. Mean significant wave heights for Sleeping Bear Dunes National Lakeshore.
Figure 12C. Mean Annual Ice Cover for Sleeping Bear Dunes National Lakeshore.
Figure 13C. Relative Coastal Change-potential for Sleeping Bear Dunes National Lakeshore.
|
The most influential variables in the CVI are geomorphology, regional coastal slope, and wave energy; therefore they may be considered the dominant factors controlling how Guam will evolve as sea level rises.
Back to Top
|
|
