
Coastal Change-Potential Assessment of Sleeping Bear Dunes, Indiana Dunes, and Apostle Islands National Lakeshores to Lake-Level Changes
USGS Open-File Report 2005-1249
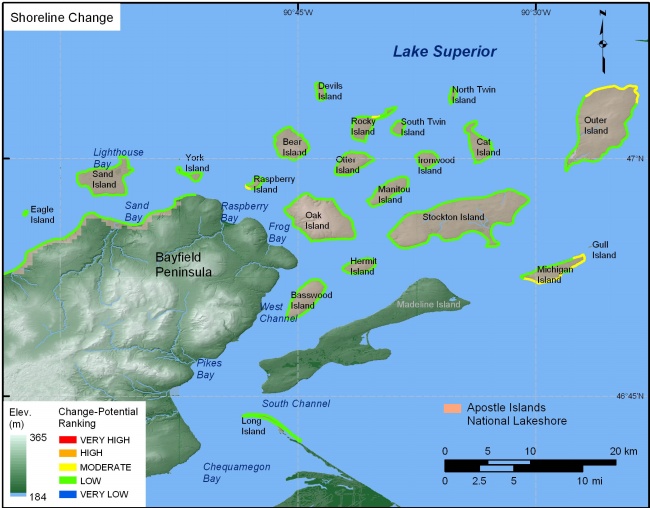
Figure 7A. Shoreline change for Apostle Islands National Lakeshore. The colored shoreline represents the estimated rate of shoreline change | ||
 |
||

![]() U.S. Department of the Interior |
U.S. Geological Survey
U.S. Department of the Interior |
U.S. Geological Survey
URL: pubsdata.usgs.gov/pubs/of/2005/1249/html/fig7a.html
Page Contact Information: Publishing Services
Page Last Modified: Saturday, 12-Jan-2013 22:13:10 EST