Title Page /
Abstract /
Report /
Figures /
References /
Acknowledgements /
Disclaimer
|
||
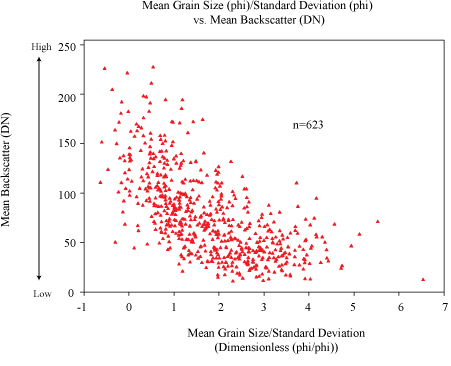
Figure 16. Plot showing mean grain size/standard deviation versus mean backscatter for surficial sediment samples collected within the study area. No statistically significant correlation exists between variables. Backscatter values were extracted from the sidescan-sonar imagery in a 10-m radius around sample location. Samples falling on backscatter transitions were excluded from analyses (99 out of 722). | ||

![]() U.S. Department of the Interior |
U.S. Geological Survey
U.S. Department of the Interior |
U.S. Geological Survey
URL: http://pubsdata.usgs.gov/pubs/of/2005/1345/html/imagepages/fig16.html
Page Contact Information: Publishing Services
Page Last Modified: Saturday, 12-Jan-2013 22:12:23 EST