Title Page /
Abstract /
Report /
Figures /
References /
Acknowledgements /
Disclaimer
 |
||
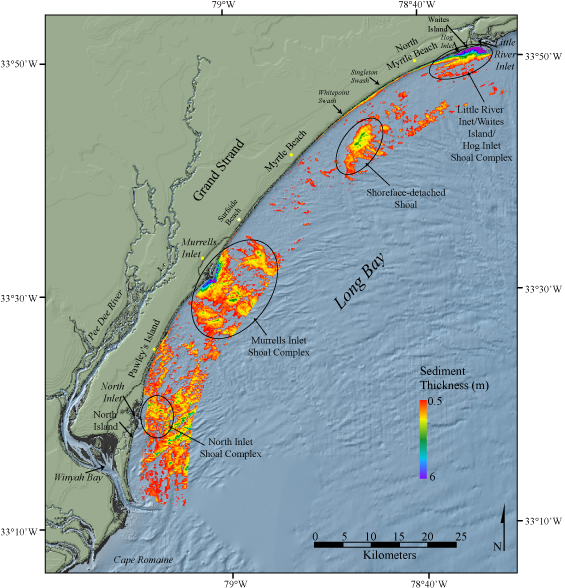
Figure 3. Map showing the thickness of modern sediment within the study area. Sediment thickness was mapped through interpretation of chirp seismic reflection data. Inlet shoal complexes and shore-detached shoals are outlined. Thicknesses are reported in meters (assuming a velocity of 1500m/sec). Areas where the sea floor bathymetry is visible indicate areas of surficial sediment < 0.5 m thick. Figure modified from Baldwin and others (2004, their figure 17). The background shaded relief imagery is a digital elevation model of the northeastern South Carolina coastal plain (NOAA-NGDC, 2001). | ||

![]() U.S. Department of the Interior |
U.S. Geological Survey
U.S. Department of the Interior |
U.S. Geological Survey
URL: http://pubsdata.usgs.gov/pubs/of/2005/1345/html/imagepages/fig3.html
Page Contact Information: Publishing Services
Page Last Modified: Saturday, 12-Jan-2013 22:12:28 EST