Title Page /
Abstract /
Report /
Figures /
References /
Acknowledgements /
Disclaimer
 |
||
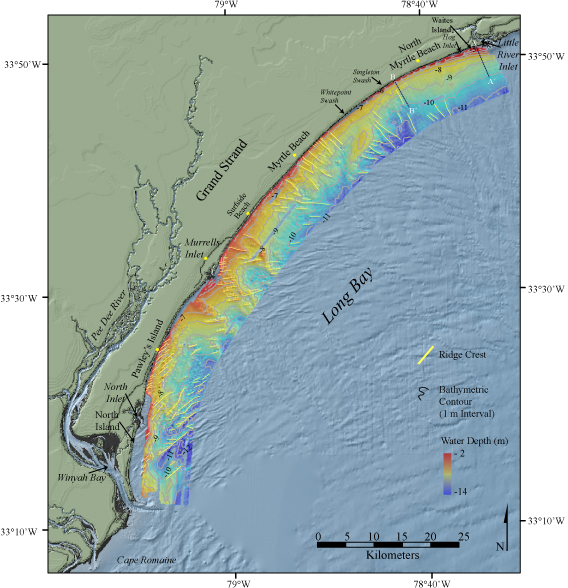
Figure 5. Map showing the bathymetry within the study area. Contour interval is 1 m. Ridge crests are displayed. Location of shoreface profiles A-A' and B-B' in figure 6 are displayed. Depth in the study area ranges from 2 to 14 meters. The background shaded relief imagery is a digital elevation model of the northeastern South Carolina coastal plain (NOAA-NGDC, 2001). | ||

![]() U.S. Department of the Interior |
U.S. Geological Survey
U.S. Department of the Interior |
U.S. Geological Survey
URL: http://pubsdata.usgs.gov/pubs/of/2005/1345/html/imagepages/fig5.html
Page Contact Information: Publishing Services
Page Last Modified: Saturday, 12-Jan-2013 22:12:30 EST