U.S. Geological Survey
Open-file Report 2006-1081
Geologic characteristics of benthic habitats in Glacier Bay, southeast Alaska | ||||||||||||||||||||||||||||||||||||||||||||||||||||||||||||||||||||||||||||||||||||||||||||||||||||||||||||||||||||||||||||||||||||||||||||||||||||||||||||||||||||||||||||||||||||||||||||||||||||||||||||||||||||||||||||||||||||
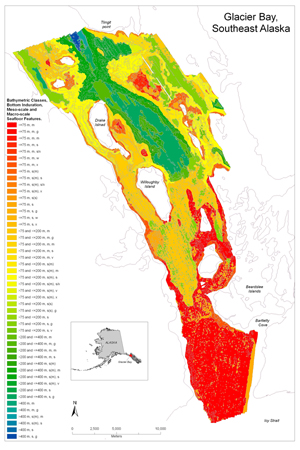
RESULTSSeafloor FeaturesSediment TypeAcoustic reflectance (backscatter) of the seafloor in Glacier Bay is shown in Figure 2 with symbols denoting primary substrate type observed in seafloor video. Coarse grain sizes (e.g. sand, pebbles, cobbles, and boulders) dominate the seafloor of the lower bay (brighter areas). Mud is the dominant sediment type in the deeper central bay (darker areas). 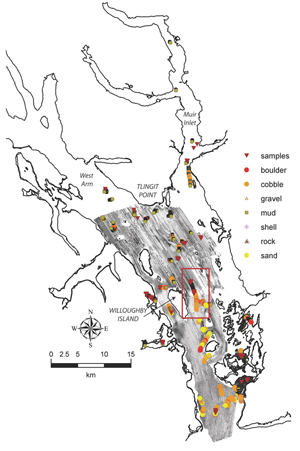
Figure 2. Multibeam acoustic reflectance in Glacier Bay , with symbols denoting primary substrate type from video observations. The boxed area corresponds to the region of transition east of Willoughby Island discussed below. To view a large version of Figure 2 in a new window, click on the image above. Our classification of sonar data does not distinguish between boulder-dominated glacial till and rock reefs because video observations in Glacier Bay revealed no complex rock outcrops. The four-class geomorphic output from ERDAS (described in Methods) served as a basemap for delineating and characterizing polygons of benthic substrates and habitat types in ArcGIS. Polygons were assigned a "bottom induration" of either "mixed" (for glacial till and coarse-sized sediments) or "soft" (for sand-sized and finer sediments). Sediment texture details (such as "sand" and "mud") were assigned to polygons where grain size was reasonably known or inferred from video observations. Sediment texture follows the Wentworth grain-size scale (Table 5). Meso/Macrohabitats Seafloor features between 1 meter and 1 kilometer in scale are defined as "Meso/Macrohabitat" types in the Greene classification system. Several interesting seafloor features were identified in acoustic data and ground-truthed using towed video, including sand waves, gullies, mud mounds, slumps, and depressions (flat basins). Codes for these features follow the Greene et al. (1999) classification system except where noted (codes we created specifically for this environment are shown in Table 6). For example, in the Greene classification system, mounds and depressions are described by the same code ("m"). Because we felt it was important to distinguish bathymetric highs and lows, we employed Greene's "m" class for mounds (high features) and created a unique "v" class for large depressions and flat-floored basins. We created a unique "x" class for polygons in nearshore settings within ~200 m of the high-tide shoreline. These nearshore polygons were also assigned an underscored descriptor to specify the bathymetric class ("x_x" for polygons shallower than 75 m water depth; "x_y" for those in 75-200 m water depth). This distinguishes shallow, more energetic nearshore settings (such as those around the Marble Islands) from shoreline margins that are steeper and deeper (such as those surrounding Tlingit Point).
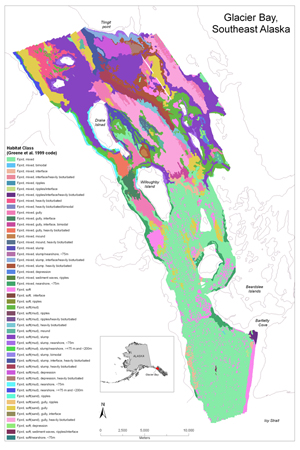
Table 6. Codes created in this study to characterize meso-scale and macro-scale seafloor features. Substrate Map The distribution of bathymetric classes, sediment type, and meso-scale and macro-scale seafloor features in Glacier Bay is illustrated in Figure 3. In general, mixed, unsorted glacial till (boulder-sized to sand-sized sediment), dominates the lower bay. The seafloor in deeper waters of the central bay is comprised of homogeneous, bioturbated mud.
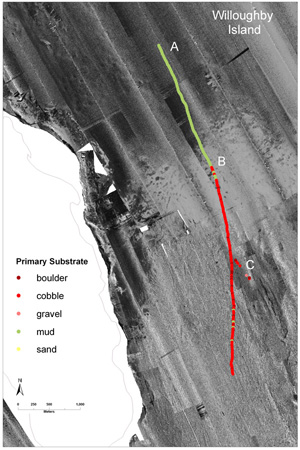
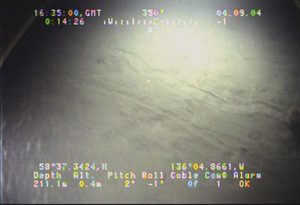
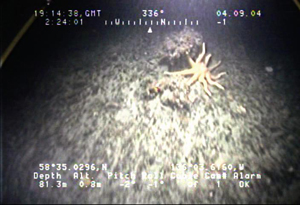
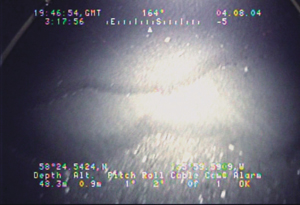
Figure 3. Map of bathymetric classes, bottom induration, and meso-scale and macro-scale seafloor features in Glacier Bay. To view a large version of Figure 3 in a new window, click on the image above. Transitional areas exist between geomorphic end-members, as shown in the acoustic data and video transect just east of Willoughby Island (Figures 2 and 4). Acoustic reflectance of the seafloor is low in the deeper, northern part of the transect, appearing dark in sonar imagery (200 m water depth). Video confirms the seafloor is low in relief and comprised of soft, muddy, bioturbated sediment (image A). Southward along the transect, acoustic reflectance increases (brightens) as seafloor sediment coarsens to cobbles and boulders (images B-C; 50-90 m water depth). These complex substrates provide habitat for gorgonians, mollusks, and other benthic organisms (images D-E).
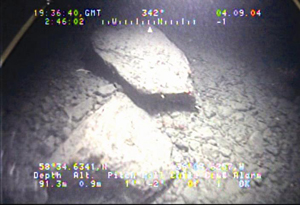
Figure 4. Acoustic backscatter data and video observations illustrate a region of transition in seafloor properties east of Willoughby Island, from soft, muddy sediment in the north (top) to coarse-grained boulders and cobbles in the south. To view a large version of Figure 4 in a separate window, click on the image above. Letters A, B, C, indicate the location of images A-C below. The field of view of these images captured from video is approximately 1-2 meters.
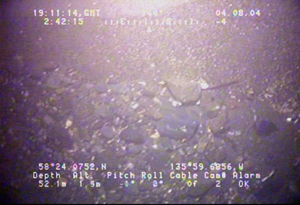
Image A. Soft, muddy, bioturbated sediment observed in seafloor video at location A in Figure 4. To view a large version of Image A in a new window, click on the image above.
Image B. Mixed coarse sediment observed in seafloor video at location B in Figure 4. To view a large version of Image B in a new window, click on the image above.
Image C. Cobbles and boulders observed in seafloor video at location C in Figure 4. To view a large version of Image C in a new window, click on the image above.
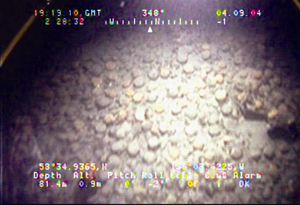
Image D. Living scallops on sand-cobble substrate observed in seafloor video collected south-east of Willoughby Island (location not shown). To view a large version of Image D in a new window, click on the image above.
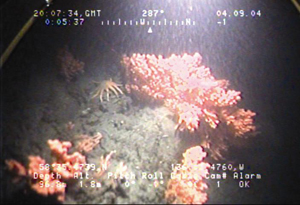
Image E. Gorgonians on complex boulder-cobble substrate observed in seafloor video collected south-east of Willoughby Island (location not shown). To view a large version of Image E in a new window, click on the image above. Sand Waves In the lower central bay (~50 m water depth), a series of obliquely-oriented features revealed in multibeam bathymetry data were observed in video ground-truthing to be steep sand waves 1-2 m in height (Figure 5). The interface between coarse cobbles and sand ripples is abrupt (image F). Pebbles, cobbles, and shells are abundant in the troughs between ripples (image G). 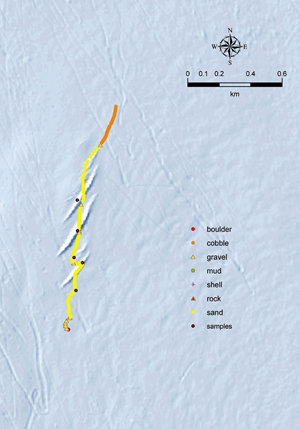
Figure 5. Obliquely-oriented features in multibeam bathymetry of lower Glacier Bay. Video observations reveal these features are sand waves 1-2 m in height. Linear features also observable in the figure are gouges in sediment caused by iceberg movement (Carlson et al. 2005). To view a large version of Figure 5 in a separate window, click on the image above.
Image F. Abrupt transition between coarse cobbles and sand waves of the lower bay shown in Figure 5. To view a large version of Image F in a new window, click on the image above.
Image G. Pebbles, cobbles, and shells are abundant in the troughs between sand waves of the lower bay shown in Figure 5. To view a large version of Image G in a new window, click on the image above. Habitat ClassificationHabitat Classification MapGeomorphic features, sediment types, and bathymetric classes are delineated as polygons in this habitat map, owing to their unique characteristics of sediment texture, physical morphology, and energetic setting, all of which are important to benthic organisms. Suspension-feeding organisms such as mussels, scallops, sponges, and corals were found on mixed substrates in areas of high current, particularly in the lower central Bay. Soft sediment benthic environments were host to halibut, flounder, Tanner crabs, shrimp, other small crustaceans, and infaunal worms. Figure 6 illustrates the distribution of benthic habitat types in Glacier Bay. Table 7 provides a translation of the benthic habitat codes used in this study. Details of the classification methodology can be found in Greene et al. (1999).
Figure 6. Benthic habitats in Glacier Bay, southeast Alaska. Classification follows Greene et al. (1999). To view a large version of Figure 6 in a new window, click on the image above. Habitat Classification Table
Table 7. Definition of benthic habitat codes in Glacier Bay, southeast Alaska. Classification follows Greene et al. (1999). |
Project Description
|
|||||||||||||||||||||||||||||||||||||||||||||||||||||||||||||||||||||||||||||||||||||||||||||||||||||||||||||||||||||||||||||||||||||||||||||||||||||||||||||||||||||||||||||||||||||||||||||||||||||||||||||||||||||||||||||||||||
|
||||||||||||||||||||||||||||||||||||||||||||||||||||||||||||||||||||||||||||||||||||||||||||||||||||||||||||||||||||||||||||||||||||||||||||||||||||||||||||||||||||||||||||||||||||||||||||||||||||||||||||||||||||||||||||||||||||
Accessibility
|
FOIA
| Privacy
|
Policies and Notices
U.S. Department of the Interior
U.S. Geological Survey
URL: http://walrus.wr.usgs.gov/2006/1081/results.html
maintained by Michael Diggles
last modified April 4, 2006 (mfd)