 |
|
Office of Surface Water
|
||||
|
Office of Surface Water |
by Bruce E. Krejmas, Gary N. Paulachok, and William J. Carswell, Jr.
U.S. Geological Survey Open File Rpeort 2006-1220
The report is available as a pdf.
January 24, 2007
The Honorable
John G. Roberts, Jr.
Chief Justice of the United States
The Honorable
Ruth Ann Minner
Governor of Delaware
The Honorable
Jon S. Corzine
Governor of New Jersey
The Honorable
Eliot Spitzer
Governor of New York
The Honorable
Edward G. Rendell
Governor of Pennsylvania
The Honorable
Michael R. Bloomberg
Mayor of the City of New York
No. 5, Original.October Term, 1950
v.
State of New York and City of New York, Defendants,
Commonwealth of Pennsylvania and State of Delaware, Intervenors.
Dear Sirs and Madam:
For the record and in compliance with the provisions of the Amended Decree of the Supreme Court of the United States entered June 7, 1954, I am transmitting herewith the 49th Annual Report of the River Master of the Delaware River for the 12-month period from December 1, 2001, to November 30, 2002. In this report, this period is referred to as the River Master report year or the report year.
During the 2002 River Master report year, monthly precipitation in the upper Delaware River Basin ranged from 32 percent of the long-term average during July 2002 to 188 percent of the long-term average during October 2002. Total precipitation during the report year was 2.73 inches more than the long-term average. Precipitation during the December to May period, when reservoirs typically refill, was 0.44 inches less than the 61-year average. Precipitation during the report year was below normal in December, January, February, July, and August, and above normal in the other seven months.
On December 1, 2001, when the report year began, combined storage in the New York City reservoirs in the upper Delaware River Basin was 66.010 billion gallons (Bgal) or 24.4 percent of combined storage capacity. Median combined storage on December 1, computed on the basis of 34 years of record, is 171.931 Bgal. On December 1, 2001, the basin entered drought emergency and operations were conducted as prescribed by the Interstate Water Management Recommendations of the Parties to the Decree (Delaware River Basin Commission Resolution 83-13). Storage increased slowly and steadily throughout the winter and spring, and operations returned to normal on May 26, 2002. Storage reached its maximum level in late June then declined seasonally until mid-October. Storage increased from mid-October to the end of the year. Operations in the basin were conducted as prescribed by the Decree from May 26, 2002 to November 30, 2002.
On May 17, 2002, the Delaware River Master Advisory Committee met at Merrill Creek Reservoir in New Jersey to discuss hydrologic conditions in the basin and operational procedures for the 2002 reservoir-release season. During the report year, the following individuals served as members of the Advisory Committee:
| Delaware | Dr. Robert R. Jordan |
| New Jersey | Bradley M. Campbell |
| New York | Phillip DeGaetano |
| New York City | Christoper O. Ward |
| Pennsylvania | Irene B. Brooks |
The River Master informed the Advisory Committee that, on the basis of information provided by New York City, the excess-release quantity beginning June 15 was 7.381 Bgal. Based on reservoir release programs in Delaware River Basin Commission (DRBC) Docket No. D-77-20 CP (Revision No. 4), the excess-release quantity was to be used for various purposes. On the basis of hydrologic conditions in early June, the Parties to the Decree unanimously agreed to suspend that portion of the excess-release quantity that was scheduled to be released.
During the report year, the River Master and staff participated in a number of water-supply related meetings of the Delaware River Basin Commission. The Deputy Delaware River Master met periodically with representatives of the Parties to the Decree as a member of the Decree Parties Work Group and DRBCs Flow Management Technical Advisory Committee. Issues of particular interest to the River Master involved reservoir releases and streamflow in the upper Delaware River Basin.
The U.S. Geological Survey (USGS) continued the operation of its field office of the Delaware River Master at Milford, Pennsylvania. Gary N. Paulachok, Deputy Delaware River Master, continued in charge of the office, assisted by Bruce E. Krejmas, Hydrologist.
During the year, the USGS office at Milford continued the weekly distribution of a summary hydrologic report. These reports contain preliminary data on precipitation in the upper Delaware River Basin, releases and spills from New York City reservoirs to the Delaware River, diversions to the New York City water-supply system, reservoir contents, daily segregation of flow of the Delaware River at the Montague gaging station, and diversions by New Jersey. The reports were distributed to members of the Delaware River Master Advisory Committee and to other parties interested in Delaware River operations. A monthly summary of hydrologic conditions also was provided to Advisory Committee members.
The first section of this report documents Delaware River operations during the report year. During the year, the City of New York diverted 184.325 Bgal from the Delaware River Basin and released 65.892 Bgal from Pepacton, Cannonsville, and Neversink Reservoirs to the Delaware River. The River Master directed releases from these reservoirs to the Delaware River totaled 48.848 Bgal.
The second section of this report describes water quality at various monitor sites on the Delaware Estuary. It includes basic data on chemical properties and physical characteristics of the water and presents summary statistics on the data.
Throughout the year, diversions to New York Citys water supply and releases designed to maintain the flow of the Delaware River at Montague were made as directed by the River Master. Diversions by New York City from its reservoirs in the Delaware River Basin did not exceed the limit stipulated by the Interstate Water Management Recommendations of the Parties to the Decree and the Decree. Diversions by New Jersey also were within stipulated limits.
The River Master and staff are grateful for the continued cooperation and support of the Parties to the Decree. Also, the contributions of the PPL Corporation and Mirant Corporation in informing the River Master of plans for power generation and furnishing data on reservoir releases are greatly appreciated.
A draft version of this report was furnished to the River Master Advisory Committee members for review and comment. These comments have been incorporated into this report.
| Sincerely yours, /Signed/ Stephen F. Blanchard Delaware River Master |
A Decree of the United States Supreme Court in 1954 established the position of Delaware River Master within the U.S. Geological Survey. In addition, the Decree authorizes diversions of water from the Delaware River Basin and requires compensating releases from certain reservoirs, owned by New York City, to be made under the supervision and direction of the River Master. The Decree stipulates that the River Master will furnish reports to the Court, not less frequently than annually. This report is the 49th Annual Report of the River Master of the Delaware River. It covers the 2002 River Master report year, that is, the period from December 1, 2001, to November 30, 2002.
During the report year, precipitation in the upper Delaware River Basin was 2.73 in. greater than the long-term average. Combined storage in Pepacton, Cannonsville, and Neversink Reservoirs was at a record low level on December 1, 2001. Reservoir storage increased steadily from mid-winter until late June. Storage declined steadily from early July to mid-October then increased through the end of the year. Delaware River operations were conducted at reduced levels from December 1, 2001, to May 25, 2002, when drought emergency conditions prevailed, and as prescribed by the Decree from May 26, 2002, to November 30, 2002.
Diversions from the Delaware River Basin by New York City and New Jersey were in compliance with the terms of the Decree or with the reduced limits in effect during drought emergency conditions. Reservoir releases were made as directed by the River Master at rates designed to meet the flow objective for the Delaware River at Montague, New Jersey, on 101 days during the report year. Releases were made at experimental conservation ratesor rates designed to relieve thermal stress and protect the fishery and aquatic habitat in the tailwaters of the reservoirson all other days.
During the report year, New York City and New Jersey complied fully with the terms of the Decree, and during drought emergency conditions, with the terms of the Interstate Water Management Recommendations of the Parties to the Decree (DRBC Resolution 83-13), and directives and requests of the River Master.
As part of a long-term program, the quality of water in the Delaware Estuary between Trenton, New Jersey, and Reedy Island Jetty, Delaware, was monitored at various locations. Data on water temperature, specific conductance, dissolved oxygen, and pH were collected by electronic instruments at four sites, and data on water temperature and specific conductance were collected at one site. In addition, selected water-quality data were collected at 3 sites on a monthly basis and at 19 sites on a semimonthly basis.
An Amended Decree of the United States Supreme Court, entered June 7, 1954, authorized diversions of water from the Delaware River Basin and provided for releases of water from three New York City reservoirs to the upper Delaware River. The Decree stipulated that these diversions and releases were to be made under the supervision and direction of the Delaware River Master. The Decree also stipulated that reports on Delaware River operations be made to the Court not less frequently than annually. This report documents operations from December 1, 2001, to November 30, 2002, or the 2002 River Master report year. The report also presents information on water quality in the Delaware Estuary during the report year.
Some hydrologic data presented in this report are records of streamflow and water quality for USGS data-collection stations. These records were collected, computed, and furnished by the offices of the USGS at Troy, New York; Malvern and New Cumberland, Pennsylvania; and West Trenton, New Jersey, in cooperation with the States of New York and New Jersey, the Commonwealth of Pennsylvania, and the City of New York. The locations of major streams and reservoirs, and selected streamflow-gaging stations in the Delaware River Basin are shown in figure 1.
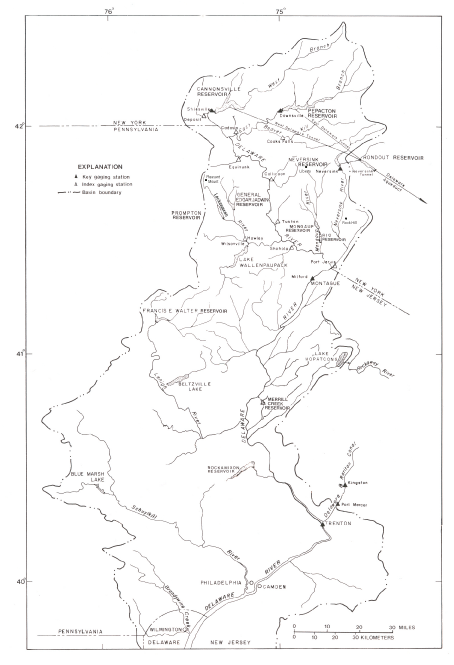
Figure 1. Delaware River Basin above Wilmington, Delaware.
The River Masters daily operation records were prepared from hydrologic data collected chiefly on a day-to-day basis. Data for these records were collected and computed by the Office of the Delaware River Master or were furnished by the following agencies and utilities: Data for Pepacton, Cannonsville, and Neversink Reservoirs by the New York City Department of Environmental Protection, Bureau of Water Supply; for Lake Wallenpaupack by the PPL Corporation; and for Rio Reservoir by Mirant Corporation. Precipitation data and quantitative precipitation forecasts were provided by the National Weather Service (NWS) office in Binghamton, New York.
The following definitions apply to various terms and procedures used in the operations documented in this report. A table for converting inch-pound units to the International System of Units (SI) is given on page vi.
Precipitation in the Delaware River Basin above Montague, New Jersey totaled 45.87 in. for the 2002 report year and was 2.73 in. more than the long-term (61-year) average. Monthly precipitation ranged from 32 percent of the long-term average in July 2002 to 188 percent of average in October 2002. Data on monthly precipitation during the report year and long-term average precipitation are presented in table 11. These figures were computed from records collected at 10 geographically distributed stations by the NWS; the New York City Department of Environmental Protection, Bureau of Water Supply; and the River Master.
The seasonal period from December to May typically is when surface-water and ground-water reservoirs fill. During this period in 2001-2002, average precipitation at the 10 stations was 19.84 in., which is 98 percent of the 61-year average. During June to November, average precipitation at the 10 stations was 26.03 in., which is 114 percent of the long-term average. The maximum monthly precipitation was 8.12 in. in October 2002, measured at Pleasant Mount, Pennsylvania; the minimum monthly precipitation was 0.71 in. in July 2002, measured at Neversink, New York (locations shown on figure 1).
:
On December 1, 2001, low storage levels in the New York City reservoirs triggered drought emergency operations in accordance with DRBC Resolution 83-13. The Montague flow objective was reduced from 1,550 ft3/s to 1,350 ft3/s, effective December 4, 2001, because the salt frontthe 7-day average location of the 250-milligrams-per-liter isochlor in the Delaware Estuarywas at river mile 86. For reference, river mile 0 is located at the mouth of Delaware Bay. The allowable diversions to New York City and New Jersey were 520 Mgal/d and 65 Mgal/d, respectively. The drought emergency was declared by DRBC Resolution No. 2001-32 (Appendix A).
From December 2001 to May 2002, the first half of the report year, total precipitation was 0.44 in. below average. Monthly precipitation ranged from 60 percent of the long-term average in February 2002 to 142 percent in May 2002 (table 1). Runoff in the upper basin was in the normal range during February; above normal during May; and below normal during December, January, March, and April.
On December 1, 2001, when the 2002 report year began, Pepacton Reservoir contained 51.280 Bgal of water in storage above the point of maximum depletion, or 36.6 percent of the 140.190 Bgal storage capacity. Cannonsville Reservoir contained 3.547 Bgal, or 3.7 percent of the 95.706 Bgal storage capacity. Neversink Reservoir contained 11.183 Bgal, or 32.0 percent of the 34.941 Bgal storage capacity. Combined storage in these reservoirs on December 1 was 66.010 Bgal, or 24.4 percent of combined capacity. Daily storage in Pepacton, Cannonsville, and Neversink Reservoirs is shown in tables 3, 4, and 5, respectively, and combined storage during the report year is illustrated in figure 2.
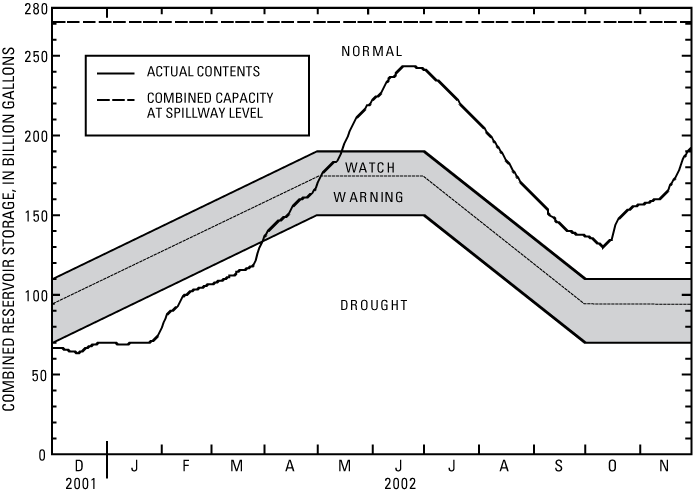
Figure 2. Operation curves and actual contents for New York City reservoirs in the Delaware River Basin, Decembe 1, 2001 to November 30, 2002.
On December 19, 2001, the Parties to the U.S. Supreme Court Decree agreed to establish an emergency fishery protection program during drought. The provisions of the program are given in Appendix B. Hydrologic conditions precluded implementation of this program and the program concluded as planned on June 15, 2002.
On December 26, 2001, the salt front was located at river mile 82 and the Montague flow objective was reduced to 1,100 ft3/s, effective December 30, 2001.
On April 3, 2002, the Decree Parties agreed to modify the reservoir releases programs as stipulated in DRBC Docket No. D-77-20 CP (Revision No. 4). DRBC Docket No. D-77-20 CP (Revision 5) extended and amended Docket Revision No. 4. The revisions established a temporary habitat bank for maintaining experimental flow targets on the West Branch Delaware River at Hale Eddy, New York and temporarily modified the conservation releases from Cannonsville Reservoir. Docket No. D-77-20 CP (Revision 5) is presented in Appendix C.
On May 26, 2002, combined storage in the New York City reservoirs increased to 15 Bgal above the drought watch zone and remained there for 5 consecutive days. As a result, the allowable diversions to New York City and New Jersey reverted to normal, 800 Mgal/d and 100 Mgal/d, respectively. The Montague flow objective increased to 1,750 ft3/s, effective May 29, 2002.
From December to May, inflow to the Citys reservoirs typically exceeds outflow and, consequently, the quantity of water in storage increases. The average inflow to Pepacton, Cannonsville, and Neversink Reservoirs for these 6 months during the 61-year period from December 1940 to May 2001 was 302.5 Bgal. During the corresponding 6 months of the report year, inflow to the three reservoirs totaled 237.1 Bgal. Evaporation loss is not included in the computations.
Combined storage fluctuated only slightly in December 2001 and January 2002 and remained at low levels. Precipitation in winter and spring mostly was near normal and temperatures moderated from late January into February. Combined storage increased steadily from February to May. The combined storage of the reservoirs was about 81 percent of capacity on May 31.
Combined storage in the three New York City reservoirs was 66.406 Bgal on November 30, 2001 and 219.982 Bgal on May 31, 2002, a net increase of 153.576 Bgal or 56.7 percent of capacity. The maximum combined storage from December to May was 219.982 Bgal on May 31. Typically, maximum storage in the individual reservoirs occurs on different days but, in 2002, storage in all the reservoirs was still increasing at the end of May. Maximum storage in Pepacton Reservoir during the December to May period was 109.218 Bgal on May 31; maximum storage in Cannonsville Reservoir was 83.244 Bgal on May 31; and maximum storage in Neversink Reservoir was 27.520 Bgal on May 31, 2002. None of these reservoirs spilled during the December to May period.
During the December to May period, diversions to Rondout Reservoir by New York City totaled 76.485 Bgal (420 Mgal/d). The forecasted discharge at Montague, exclusive of water released from the City reservoirs, was less than the flow objective on 10 days in December, and releases were directed. The observed daily mean discharge at Montague was less than the applicable flow objective on 13 days, but all observed flows were within 15 percent of the flow objective.
Applicable design rates for the gaging station Delaware River at Montague, New Jersey are presented in table 6.
Monthly precipitation from June to November was above average in June, September, October, and November and below average in July and August. Total precipitation during the period was 26.03 in. or 3.17 in. more than the 61-year average (table 1).
Releases were directed to meet the Montague flow objective on 91 days between June 1 and November 30, 2002, when the forecasted discharge at Montague, exclusive of water released from the New York City reservoirs, was less than the flow objective. Releases at experimental conservation rates or at rates designed to protect the fishery and aquatic habitat were made at other times during the period.
From June 1 to June 14, the Montague flow objective was 1,750 ft3/s. The forecasted flow, exclusive of releases from Pepacton, Cannonsville, and Neversink Reservoirs, did not fall below the flow objective and no releases were directed.
The New York City Department of Environmental Protection, Bureau of Water Supply, Quality, and Protection furnished the River Master with the following data for the 2002 calendar year, as stipulated by the Decree:
On the basis of the Decree and the aforementioned data, the aggregate quantity of excess-release water was 83 percent of (607.725 - 598.832), or 7.381 Bgal.
Data on water consumption by the City of New York for each calendar year since 1950, from all sources of supply, are presented in table 7.
As part of the reservoir release programs described in DRBC Docket No. D-77-20 CP (Revision No. 5), about 50 percent of the annual excess-release quantity was placed in a fishery protection bank to augment releases during drought warning. The remainder of the excess-release quantity could be used to provide an increase in the Montague flow objective or could be banked in accordance with the procedures outlined in the DRBCs Lower Basin Drought Management Plan.
On June 10, 2002, the Decree Parties unanimously agreed to suspend release of one-half of the excess-release quantity for the 2002-2003 seasonal period on the basis of hydrologic conditions and below-normal storage levels in the New York City reservoirs. The agreement to suspend release of this portion of the excess-release quantity is given in Appendix D.
On June 15, 2002, the beginning of the seasonal excess-release period, the Montague flow objective remained at 1,750 ft3/s. Storage in the New York City reservoirs declined steadily from late June to mid-October, when runoff from heavy rain caused storage to increase. Storage continued to increase steadily through the end of the report year.
On July 17, 2002, DRBC Docket No. D-77-20 CP (Revision 5) was amended to account for modifications in the authorized uses of the Habitat Bank. The amended Docket is given in Appendix E.
On November 25, 2002, the drought emergency was terminated by DRBC Resolution No. 2002-31. The Resolution is presented in Appendix F.
Between June 15 and November 30, 2002, the forecasted flow at Montague, exclusive of releases from the New York City reservoirs, was less than the flow objective on 91 days and releases were directed. On 43 days during the June 15 to November 30 period, the observed flow was less than the flow objective. On 34 of these 43 days, observed flows were within 10 percent of the flow objective. Applicable design rates for the gaging station Delaware River at Montague, New Jersey are presented in table 6.
The total discharge measured at Montague, the portion derived from uncontrolled runoff from the drainage area below the reservoirs, the portion contributed by power reservoirs, and the portion contributed by Pepacton, Cannonsville, and Neversink Reservoirs from July to October are shown in figure 3. In developing the water budget for Montague, uncontrolled runoff was computed as the residual of observed flow minus releases and spills from all reservoirs, and, therefore, was subject to errors in observations, transit times, and routing of the various components of flow. The conservation release from Rio Reservoir is included in the uncontrolled runoff component. The net effect of these uncertainties is incorporated in the derived hydrograph of uncontrolled runoff. Diversions to Rondout Reservoir from June 1 to November 30, 2002, totaled 107.840 Bgal.
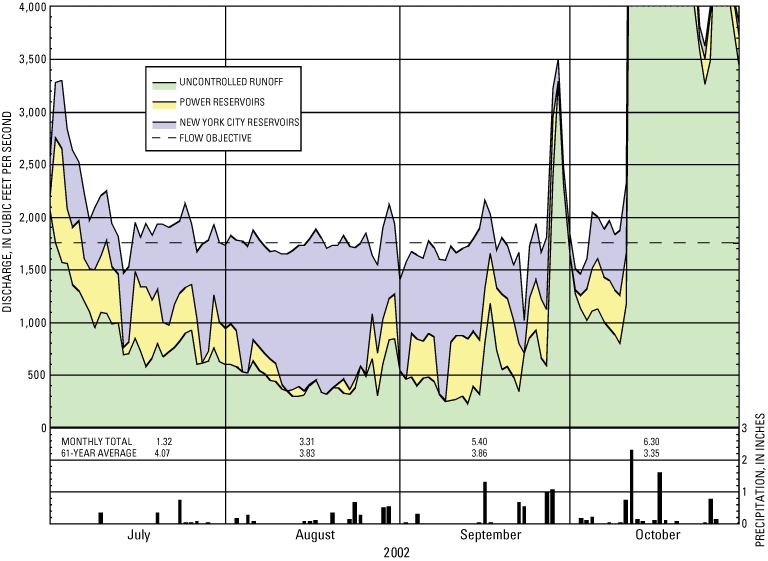
Figure 3. Components of flow, Delaware River at Montague, New Jersey, July 1 to November 30, 2002.
From December 1, 2001, to November 30, 2002, diversions from the three New York City reservoirs in the upper Delaware River Basin to Rondout Reservoir totaled 184.325 Bgal, and all releases from the three reservoirs to the Delaware River totaled 65.892 Bgal. River Master directed releases to the Delaware River from these reservoirs totaled 48.869 Bgal.
During the year, maximum storage in Pepacton Reservoir was 123.756 Bgal on June 30; 89.408 Bgal in Cannonsville Reservoir on June 19; and 31.266 Bgal in Neversink Reservoir on June 24. Maximum combined storage in the three reservoirs was 243.584 Bgal on June 24, 2002. None of the reservoirs spilled during the year.
During the year, minimum storage in Pepacton Reservoir was 45.579 Bgal (32.5 percent of capacity) on January 24, 2002; 3.547 Bgal (3.7 percent of capacity) in Cannonsville Reservoir on December 1, 2001; and 11.183 Bgal (32.0 percent of capacity) in Neversink Reservoir on December 1, 2001. Minimum combined storage in the three reservoirs was 63.348 Bgal (23.4 percent of combined capacity) on December 15, 2001.
On November 30, 2002, the end of the report year, combined storage in the three reservoirs was 192.441 Bgal or 71.1 percent of combined capacity. During the year, the net change in combined storage was +126.035 Bgal, or an increase equivalent to 46.5 percent of combined capacity.
The distribution of combined storage for the three reservoirs on the first day of the month, for the reference period June 1967 to November 2001, and for the report year, is shown in figure 4. Storage was below the median from December to October and above the median in November. Storage was below the 25th percentile in all months except July, August, and November. Record lows for the first day of the month were set in December, January, March, and April.
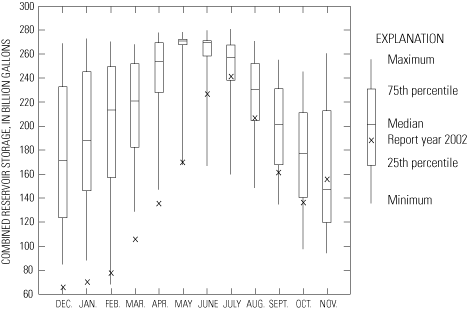
Figure 4. Combined storage in Pepacton, Cannonsville, and Neversink Reservoirs on the first day of the month, December 2001 to November 2002 (this report year), and summary statistics for the reference period, June 1967 to November 2001.
An agreement between the PPL Corporation and New York City provides for supplemental releases from the Wallenpaupack hydroelectric powerplant if the DRBC requests compensation for water consumed at PPLs Martins Creek steam-electric generating station. Releases may be requested if the flow of the Delaware River at Trenton, New Jersey, is expected to be less than 3,000 ft3/s for more than 3 consecutive days. No supplemental releases were requested during the report year.
The data and computations of the various components of flow form the basic operational records used by the River Master to carry out specific responsibilities related to the Montague formula. The operational record has two parts: forecasted flow at Montague, exclusive of controlled releases from New York Citys reservoirs (table 8), and segregation of components of daily mean flow at Montague (table 9).
The following components may be present in the flow of the Delaware River at Montague:
The releases from New York Citys reservoirs necessary to maintain the Montague objective were computed on the basis of the forecasted flow at Montague, exclusive of controlled releases from the reservoirs.
Following are average times for the effective travel of water from the various sources of controlled supply to Montague. These times were used for flow routing during the 2002 report year.
| Source | Hours |
|---|---|
| Pecpacton Reservoir Cannonsville Reservoir Neversink Reservoir Lake Wallenpaupack Rio Reservoir |
60 48 33 16 8 |
The travel times were computed from reservoir and powerplant operations data and historical streamflow records. The travel times generally are suitable for use in the operations of the River Master. Occasionally, however, significant exceptions are observed. For example, when a large release from Cannonsville Reservoir follows a small release, a substantial portion of the water fills the channel en route, and the remainder may arrive at Montague, New Jersey as much as 18 hours later. During winter, the formation of ice cover, together with lower streamflow, gradually increases the resistance to flow, resulting in increased travel times. Because ice-affected travel times increase gradually over several days, and releases were not directed to meet the Montague objective during periods of ice cover, no adjustments were made to compensate for increased travel times during these periods of the report year.
The River Master daily operations record of reservoir releases and segregation of the various components contributing to the flow of the Delaware River at Montague, New Jersey are presented in table 9. The data are arranged to conform to the downstream movement of water from the various sources to Montague. Summation of data along individual rows in the table is equivalent to routing the various flow contributions to Montague, using the aforementioned average travel times. Uncontrolled runoff was computed as a residual by subtracting the flow contributions of all other sources from the observed discharge at Montague.
During the report year, the River Master used the following information for daily operations: (1) discharges computed from recorded or reported stream gage heights, for various 24-hour periods, absent real-time information on any changes in stage-discharge relations; (2) daily discharge from New York Citys three reservoirs, measured with venturi meters; (3) precipitation reports for the previous 24 hours; (4) actual powerplant releases converted to daily discharges; (5) advance estimates of power demand converted to daily discharge; (6) advance estimates of uncontrolled runoff at Montague; and (7) average travel times for routing water from various sources. Although uncertainty is inherent in forecasts of future conditions, these data by necessity are used in the daily design and direction of reservoir releases.
The 60-hour travel time of water from Pepacton Reservoir to Montague is greater than the travel time of water from any other reservoir in the upper Delaware River Basin. Releases from Cannonsville and Neversink Reservoirs were timed to arrive at Montague concurrently with releases from Pepacton Reservoir. To allow for differences in travel times, daily directed releases were scheduled to begin from Pepacton Reservoir at 1200 hours, from Cannonsville Reservoir at 2400 hours, and from Neversink Reservoir at 1500 hours the following day.
Releases from the Citys reservoirs required to maintain the specified flow at Montague were computed from forecasts of releases from Lake Wallenpaupack and Rio Reservoir and estimates of uncontrolled runoff at Montague. To account for the travel times from these sources to Montague, the computation requires that estimates of the following components of flow be made two or more days in advance: (1) release of water from Lake Wallenpaupack; (2) release of water from Rio Reservoir; and (3) uncontrolled runoff at Montague. The River Master operations record for computing daily directed release requirements during periods of low flow is given in table 8.
The electric utilities furnished forecasts of power generation and releases. Because the hydroelectric plants were used chiefly for meeting peak-power demands, the forecasts were subject to various modifying factors including the vagaries of weather on electricity demand. In addition, because the power companies are members of regional power pools, demand for power outside of the local service area may unexpectedly affect generation schedules. Consequently, at times, the actual use of water for power generation differed considerably from the forecasts used in the design of reservoir releases.
For computational purposes during periods of low flow, estimates of uncontrolled runoff at Montague were treated as two components: (1) current runoff and (2) forecasted increase in runoff from precipitation. Estimates of these components are given in table 8.
During ice-free conditions, current runoff was computed using a routing and recession procedure based on discharges at 0800 hours at the following USGS gaging stations:
| Station Name | Drainage Area (mi2) |
|---|---|
| Beaver Kill at Cooks Falls, New York Cadosia Creek at Cadosia, New York Oquaga Creek at Deposit, New York Equinunk Creek at Equinunk, Pennsylvania Callicoon Creek at Callicoon, New York Tenmile River at Tusten, New York Lackawaxen River at Hawley, Pennsylvania Shohola Creek near Shohola, Pennsylvania Neversink River at Port Jervis, New York |
241 17.9 67.6 56.3 110 45.6 290 83.6 336 |
During the winter period, the advance estimate of uncontrolled runoff (current conditions) was made on the basis of flows at a reduced network of gaging stations and the recession curve for computed uncontrolled flow at Montague.
The forecasted runoff from precipitation is shown in table 8 under the heading Weather Adjustment. Throughout the year, the NWS office in Binghamton, New York, furnished quantitative forecasts of average precipitation and air temperatures, for the drainage basin above Montague, New Jersey. During winter, runoff was estimated on the basis of the current status of snow and ice, along with forecasted precipitation and temperature. During other periods, forecasted precipitation was used to estimate runoff.
The forecasted flow at Montague, exclusive of releases from New York Citys reservoirs (table 8), is computed as the sum of forecasted releases from power reservoirs, estimated uncontrolled runoff including conservation releases from Rio Reservoir, and weather adjustments. If the computed total flow was less than the flow objective at Montague, then the deficiency was made up by River Master directed releases from the Citys reservoirs.
When forecasts of precipitation or powerplant releases were revised appreciably after a release was directed, the release required from the reservoirs was recomputed. Commonly, this procedure resulted in a reduced release requirement for New York City reservoirs for that day and, consequently, water was conserved. Only final figures for releases from New York City reservoirs are given in table 8.
Forecasts of streamflow at Montague, developed on the basis of anticipated contributions from the components described previously (excluding releases from New York Citys reservoirs), differed on most days from observed flow. Occasionally, variations in the components were partially compensating and observed flows were in good agreement with forecasted flows.
The forecasted flow of the Delaware River at Montague, exclusive of releases from New York City reservoirs, was less than the flow objective on most days from July 7 to October 13, 2002. The following tabulation compares estimates of three components of flow at Montague with actual operations during this period.
| Releases and Runoff | Forecasted flow [(ft3/s)-d] |
Actual flow [(ft3/s)-d] |
|---|---|---|
| Power releases Lake Wallenpaupack Rio Reservoir Runoff from uncontrolled area |
29,282 1,801 74,773 |
29,141 2,067 88,110 |
From July 7 to October 13, actual releases from Lake Wallenpaupack averaged 0.5 percent less than forecasted releases, and actual releases from Rio Reservoir averaged 15 percent more than forecasted releases. Observed runoff from the uncontrolled area was about 18 percent more than forecasted runoff, but most of this difference resulted from underpredicted excessive rainfall in early October.
On any given day, the forecasted releases and actual releases can differ considerably. The ranges of actual daily releases from July 7 to October 13, 2002, are as follows: daily releases at Lake Wallenpaupack differed by 159 ft3/s less to 186 ft3/s more than forecasted releases, and daily releases at Rio Reservoir differed by 71 ft3/s less to 124 ft3/s more than forecasted releases. On the basis of observed flows at Montague, total directed releases from New York Citys reservoirs during the report year were 0.7 percent less than that required for exact forecasting.
Comparison of hydrographs of forecasted daily runoff and observed daily runoff from the uncontrolled area (fig. 5) indicates that the forecasts generally were suitable for use in designing releases from New York Citys reservoirs. Numerical adjustments to the designs were made when needed to compensate for errors in the forecasts, but, because of travel times, the effects of the adjustments on flows at Montague are not evident until several days after the design date.
Analysis of the quantitative precipitation forecasts shows that the total precipitation amount forecasted for the 3-day design periods is reasonably accurate, but often the actual timing of storms may be earlier or later than forecasted. The accuracy of the runoff forecasts is affected greatly by the timing of precipitation events. In addition, if the actual storm track differs from the forecasted track, the amount and timing of runoff can be substantially different than predicted.
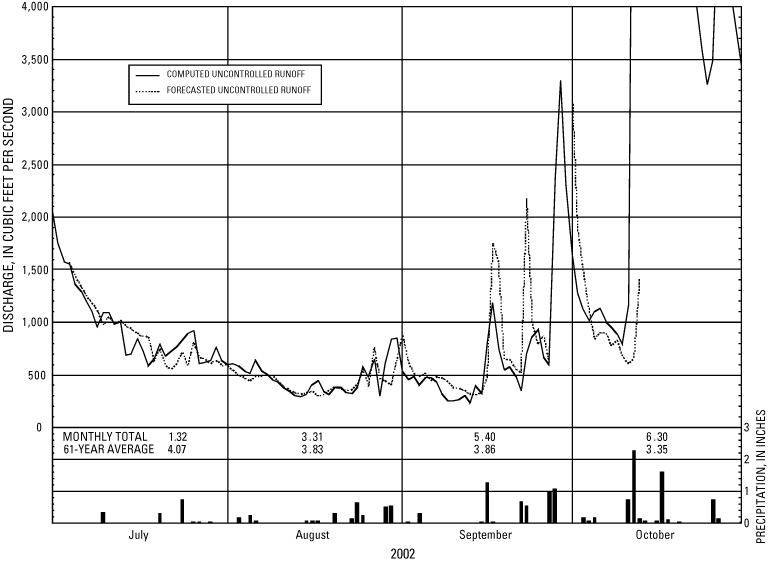
Figure 5. Uncontrolled runoff component, Delaware River at Montague, New Jersey, July 1 to November 20October 31, 2002.
The 1954 Amended Decree authorizes New York City to divert water from the Delaware River Basin at a rate not to exceed the equivalent of 800 Mgal/d. The Decree specifies that the diversion rate shall be computed as the aggregate total diversion beginning June 1 of each year divided by the number of days elapsed since the preceding May 31.
Diversions during the report year from Pepacton, Cannonsville, and Neversink Reservoirs to the New York City water-supply system (Rondout Reservoir) are given in table 10. Included is a running account of the average rates of combined diversions from the three reservoirs, computed as prescribed by the Decree or the Interstate Water Management Recommendations of the Parties to the Decree (DRBC Resolution 83-13). The following tabulation shows allowable maximum diversion rates and average actual diversions for various periods during the report year.
| Effective dates | Allowable diversion (Mgal/d) |
Average actual diversion (Mgal/d) |
|---|---|---|
| December 1, 2001, to May 25, 2002 May 26 to May 31, 2002 June 1 to November 30, 2002 |
520 800 800 |
421 390 589 |
During the year, a total of 184.325 Bgal of water was diverted to the New York City water-supply system. The allowable diversion was 242.720 Bgal.
The following tabulation summarizes the point of maximum depletion and other pertinent levels and contents of Pepacton, Cannonsville, and Neversink Reservoirs. This information was provided by the New York City Board of Water Supply.
| Level | Pepacton Reservoir | Cannonsville Reservoir | Neversink Reservoir | |||
|---|---|---|---|---|---|---|
| Elevation (ft) | Contents (Bgal) |
Elevation (ft) | Contents (Bgal) |
Elevation (ft) | Contents (Bgal) | |
| Full pool or spillway crest Point of maximum depletion Sill of diversion tunnel Sill of river outlet tunnel Dead Storage |
1,280.00 1,152.00 1,143.00 1,126.50 |
*140.190 *3.511 *4.200 1.800 |
1,150.00 1,040.00 +1,035.00 1,020.50 |
*95.706 *1.020 *1.564 0.328 |
1,440.00 1,319.00 1,314.00 1,314.00 |
*34.941 *0.525 1.680 |
| *Contents shown are quantities stored between listed elevations. +Elevation of mouth of inlet channel of diversion works. | ||||||
Storage in Pepacton, Cannonsville, and Neversink Reservoirs, above the point of maximum depletion, or minimum full-operating level, is given in tables 3, 4, and 5.
On December 1, 2001, combined storage in the three reservoirs was 66.010 Bgal, or 24.4 percent of combined capacity. As discussed previously, storage increased moderately during winter and spring, reaching nearly 90 percent of capacity in late June. None of the three reservoirs spilled during the year. Combined storage of 243.584 Bgal was the maximum for the year on June 24, 2002. The seasonal decline in storage began in late June, later than usual. Combined storage declined to 192.441 Bgal, or 71.1 percent of combined capacity, on November 30, 2002.
River Master operations are conducted on a day-to-day basis and, by necessity, use preliminary data on streamflow. In this section, records used in River Master operations are compared to final data published for selected USGS gaging stations. Data on releases were reported in million gallons per day and converted to cubic feet per second for use in the comparisons.
River Master operations data on controlled releases from Pepacton, Cannonsville, and Neversink Reservoirs to the Delaware River were furnished by New York City. These data were obtained from calibrated instruments connected to venturi meters installed in the outlet conduits of the reservoirs.
The USGS gaging station on East Branch Delaware River at Downsville, New York, is 0.5 mile downstream from Downsville Dam (fig. 1). Discharge measured at this station includes releases from Pepacton Reservoir and a small amount of seepage and any runoff that enters the channel between the dam and the gaging station. The drainage area is 371 mi2 at the dam and 372 mi2 at the gaging station.
The following tabulation compares releases from Pepacton Reservoir (table 9), reported by New York City, to the final records for the USGS gaging station on East Branch Delaware River at Downsville, New York (table 11), for the flow objectives shown.
|
Flow objective (ft3/s) New York City-measured flow (ft3/s) USGS-measured flow (ft3/s) Percent difference* |
6 6.3 6.8 -7.4 |
19 18.6 20.4 -8.8 |
45 46.0 42.9 +7.2 |
70 69 63.3 +10.0 |
95 94.4 86.5 +9.1 |
| *Computed as (New York City-measured flow minus USGS-measured flow) | x100 |
| (USGS-measured flow) |
The differences at all flow rates are less than or equal to 10 percent. During the report year, the River Masters office made four discharge measurements immediately below Downsville Dam. Three measurements yielded differences similar to those in the tabulation at the 6 and 19 ft3/s flow objectives. One measurement at the 70 ft3/s flow objective showed a difference between the flow objective and measured flow of less than 2 percent, which is significantly less than the difference shown in the tabulation. The calibration of instruments connected to the venturi meters was adjusted periodically by New York City to improve the accuracy of the recorded data.
The USGS gaging station on West Branch Delaware River at Stilesville, New York, is 1.4 miles downstream from Cannonsville Dam (fig. 1). Discharge measured at this station includes releases from Cannonsville Reservoir and runoff from 2 mi2 of drainage area between the dam and the gaging station. The drainage area is 454 mi2 at the dam and 456 mi2 at the gaging station.
The following tabulation compares releases from Cannonsville Reservoir (table 9), reported by New York City, to the final records for the USGS gaging station on West Branch Delaware River at Stilesville, New York (table 12), for the flow objectives shown.
|
Flow objective (ft3/s) New York City-measured flow (ft3/s) USGS-measured flow (ft3/s) Percent difference* |
8 8.0 11.0 -27.3 |
23 25.3 33.1 -23.6 |
45 46.8 53.1 -11.9 |
200-800 388 414 -6.3 |
800-1300 1,064 1,142 -6.8 |
| *Computed as (New York City-measured flow minus USGS-measured flow) | x100 |
| (USGS-measured flow) |
The gaging-station records are considered fair at flows greater than 100 ft3/s and poor at flows less than 100 ft3/s. The records include runoff from precipitation on the area between the dam and the gaging station and seepage near the base of the dam. On January 21, 1998, the seepage was measured at 3.9 ft3/s, which was greater than rates estimated in prior years. The differences in flow between reservoir-release records and USGS gaging-station records continue to be monitored by the River Masters office, in cooperation with New York City and the USGS Water Science Center in Troy, New York. To further investigate the differences, three discharge measurements were made during the report year, just below the Cannonsville release outlet. By measuring flow at this location, most of the runoff contribution from the drainage area between the outlet and the gaging station is eliminated, although seepage near the base of the dam is included. The first measurement differed from New York City release records by +3.6 percent (unadjusted) for the 8 ft3/s flow objective and no seepage was apparent at the time of the measurement. The second measurement differed from the release records by -7.1 percent (unadjusted) and +7.9 percent (adjusted) for the 23 ft3/s flow objective. The third measurement differed from the release records by -12.7 percent (unadjusted) and -5.4 percent (adjusted) for the 45 ft3/s flow objective.
The USGS gaging station on Neversink River at Neversink, New York, is 1,650 feet downstream from Neversink Dam (fig. 1). Discharge measured at this station includes releases from Neversink Reservoir and, during storms, a small amount of runoff that originates between the dam and the gaging station. The drainage area is 92.5 mi2 at the dam and 92.6 mi2 at the gaging station.
The following tabulation compares releases from Neversink Reservoir (table 9), reported by New York City, to the final records for the USGS gaging station on Neversink River at Neversink, New York (table 13), for the flow objectives shown.
|
Flow objective (ft3/s) New York City-measured flow (ft3/s) USGS-measured flow (ft3/s) Percent difference* |
5 4.6 5.0 -8.0 |
15 15.5 14.8 +4.7 |
25 24.8 25.6 -3.1 |
53 52.5 60.6 -13.4 |
90 89.7 95.4 -6.0 |
| *Computed as (New York City-measured flow minus USGS-measured flow) | x100 |
| (USGS-measured flow) |
From October 1-23, 2002, USGS-measured flows were about two times greater than the New York City-measured flows of 25 ft3/s. These differences may have resulted from electric power-supply problems that potentially affected the accuracy of the New York City flow-measuring instruments.
The River Masters office made three discharge measurements during the year to further investigate the differences between reservoir-release records and USGS gaging-station records. These measurements yielded differences within 6 percent of those in the tabulation at flows of 5, 15, and 25 ft3/s.
Records of daily discharge through the Wallenpaupack powerplant were furnished by the PPL Corporation and published by the USGS as Wallenpaupack Creek at Wilsonville, Pennsylvania (table 14). These discharges represent the flow through the turbines of the powerplant and were computed on a midnight-to-midnight basis. For River Master operations, flows were computed on a 24-hour basis beginning at 0800 hours to compensate for the 16-hour travel time to Montague, New Jersey (table 9).
From December 2001 to November 2002, the River Masters record agrees with the published USGS record except for some very small differences that result mainly from differences in time frame and rounding of computations. Overall, the records agree to within 0.2 percent for the year.
The River Masters operations record for the Delaware River at Montague, New Jersey (table 9), showed 0.1 percent more discharge for the report year than the published USGS record for the gaging station (table 15). Daily values for the two records were in good agreement.
Records of diversions through the East Delaware, West Delaware, and Neversink Tunnels (fig. 1) were furnished by the City of New York. These records were obtained from the Citys calibrated instruments connected to venturi meters installed in the tunnel conduits. The measured flows were transmitted electronically, on a 15-second interval, to the New York City Department of Environmental Protection computer at the Rondout Effluent Chamber. On 5-minute intervals, release and diversion quantities for the preceding 5-minute period were computed using the instantaneous rate-of-flow data from each instrument. These 5-minute quantities were then summed to compute daily total flows, which were reported to the River Masters office on a daily basis. On a weekly basis, the diversion figures were checked against the flow meter totalizer readings and corrected when necessary. Periodic current-meter measurements were made by the River Masters office to verify the reported diversions. The measurements were made in the outlet channels below the tunnels.
The East Delaware Tunnel is used to divert water from Pepacton Reservoir to Rondout Reservoir. Conditions in the outlet channel of the East Delaware Tunnel were unfavorable for flow measurements during the report year because of high water levels in Rondout Reservoir. Comparison of diversion data provided by New York City with gage height record for the outlet channel of the East Delaware Tunnel did not indicate any large discrepancies in diversions reported by the City.
The generating plant at the downstream end of the East Delaware Tunnel operated most days of the report year. When the powerplant was not in operation, some water leaked through the wicket gates and was not recorded on the totalizer. A current-meter measurement made in 1989 shows that the (assumed constant) rate of leakage is about 8.0 Mgal/d. Because the powerplant was not in operation for the equivalent of 172 days during the 2002 report year, the unmeasured leakage totaled about 1.4 Bgal. The record of diversions through the East Delaware Tunnel is considered essentially correct.
The West Delaware Tunnel is used to divert water from Cannonsville Reservoir to Rondout Reservoir. Inspections of the channel below the outlet, when valves were closed, revealed only negligible leakage.
A hydroelectric powerplant uses water diverted through the West Delaware Tunnel, but the plant operates only when diversions are less than 300 Mgal/d. When the powerplant is not operating, the valves on the pipelines to the plant are closed, and there is no leakage through the system. The results of the measurements and inspections made during the report year and previous years indicate that the reported record of diversions through the West Delaware Tunnel is considered essentially correct.
The Neversink Tunnel is used to divert water from Neversink Reservoir to Rondout Reservoir. The record of diversions through the Neversink Tunnel is considered essentially correct.
A hydroelectric plant uses water diverted through the Neversink Tunnel. When the powerplant is not operating and the main valve on the diversion tunnel is open, leakage develops that is not recorded on the venturi instruments. One current-meter measurement made in 1999 showed a leakage rate of 16.2 ft3/s (10.5 Mgal/d). When the powerplant is operating, the leakage is included in the recorded flow. No leakage occurs when the main valve on the tunnel is closed.
During the 2002 report year, the powerplant operated part of the day on most days and was not operated the equivalent of 283 days. Using the leakage rate noted above and records of power-plant operation, nearly 3.0 Bgal of water was diverted but not recorded.
The Amended Decree authorizes New Jersey to divert water from the Delaware River or its tributaries in New Jersey, to areas outside the Delaware River Basin, without compensating releases. These diversions may not exceed 100 Mgal/d as a monthly average, and the daily mean diversion may not exceed 120 Mgal/d. The USGS gaging station on Delaware and Raritan Canal at Port Mercer, New Jersey (fig. 1), is used as the official control point for measuring diversions by New Jersey (table 16).
The following tabulation gives the allowable diversion by New Jersey, the period it was in effect, and the maximum monthly diversion during the report year:
| Effective dates | Allowable monthly average diversion (Mgal/d) |
Maximum monthly average diversion (Mgal/d) |
Month of maximum average diversion |
|---|---|---|---|
| Dec. 1, 2001, to May 25, 2002 May 26, 2002, to Nov. 30, 2002 |
65 100 |
63.3 95.0 |
February July |
The maximum daily mean diversion was 100 Mgal on July 22, August 19, and October 3, 2002. Diversions by New Jersey were within the limits prescribed by the Decree or the reduced limits of the Interstate Water Management Recommendations of the Parties to the Decree.
From December 1, 2001, to May 25, 2002, operations of the Delaware River Master were conducted as prescribed by the Interstate Water Management Recommendations of the Parties to the Decree (DRBC Resolution 83-13 and Extension of DRBC Docket No. D-77-20 CP (Revision No. 4), which were designed to alleviate impending or actual drought conditions in the basin. From May 26, 2002, to November 30, 2002, operations of the Delaware River Master were conducted as stipulated by the Decree.
Diversions from the Delaware River Basin to the New York City water-supply system were less than those authorized by the Decree and the Interstate Water Management Recommendations of the Parties to the Decree. Under compensating releases of the Montague Formula, New York City released water from its reservoirs at rates designed by the River Master to maintain the applicable flow objectives at Montague, New Jersey. During the report year, New York City complied fully with the directives of the River Master.
Diversions from the Delaware River Basin by New Jersey were within limits prescribed by the Decree and the Interstate Water Management Recommendations of the Parties to the Decree. New Jersey complied fully with all requests made by the River Master.
Table 1. Precipitation in the Delaware River Basin above Montague, New Jersey
Table 2. Conservation release rates for New York City reservoirs in the Delaware River Basin
Table 3. Storage in Pepacton Reservoir, New York, for year ending November 30, 2002
Table 4. Storage in Cannonsville Reservoir, New York, for year ending November 30, 2002
Table 5. Storage in Neversink Reservoir, New York, for year ending November 30, 2002
Table 6. Design rates for Delaware River at Montague, New Jersey, gaging station, December 1, 2001, to November 30, 2002
Table 7. Consumption of water by New York City, 1950 to 2002
Table 8. New York City reservoir release design data
Table 9. Controlled releases from reservoirs in the upper Delaware River Basin and segregation of flow of Delaware River at Montague, New Jersey
Table 10. Diversions to New York City water supply
Table 11. Daily mean discharge, East Branch Delaware River at Downsville, New York (station number 01417000) for year ending November 30, 2002
Table 12. Daily mean discharge, West Branch Delaware River at Stilesville, New York (station number 01425000) for year ending November 30, 2002
Table 13. Daily mean discharge, Neversink River at Neversink, New York (station number 01436000) for year ending November 30, 2002
Table 14. Daily mean discharge, Wallenpaupack Creek at Wilsonville, Pennsylvania (station number 01432000) for year ending November 30, 2002
Table 15. Daily mean discharge, Delaware River at Montague, New Jersey (station number 01438500) for year ending November 30, 2002
Table 16. Diversions by New Jersey; daily mean discharge, Delaware and Raritan Canal at Port Mercer, New Jersey (station number 01460440) for year ending November 30, 2002
This section describes the water-quality monitoring program for the Delaware Estuary during the River Master 2002 report year, December 1, 2001, to November 30, 2002. This program is conducted by the USGS, in cooperation with the DRBC. Selected data collected for this program are presented and water-quality conditions are summarized. The DRBC and others use these data to assess water-quality conditions and track the movement of the salt front in the Delaware Estuary.
As part of a long-term program, the quality of water in the Delaware Estuary between Trenton, New Jersey, and Reedy Island Jetty, Delaware, is monitored at various locations (fig. 6). Data on water temperature, specific conductance, dissolved oxygen, and pH were collected by electronic instruments at four sitesTrenton, Benjamin Franklin Bridge (Philadelphia), Chester, and Reedy Island Jetty. Data on water temperature and specific conductance were collected in the same manner at Fort Mifflin. Water-quality monitors at these locations were operated continuously throughout the report year.
Water-quality data were collected on a monthly basis in March, June, July, and October, and on a semimonthly basis in April, May, August, and September 2002 at 19 sites between Biles Channel and Mahon River (sample sites A-T on fig. 6). These data were collected by the State of Delaware for the DRBC. At each of these sites, water samples were collected near the center of the channel and analyzed for selected physical properties and chemical constituents including temperature, chloride, alkalinity, specific conductance, dissolved oxygen, pH, nutrients, and trace metals. These analyses consist of field measurements and laboratory determinations.
From March to October, water-quality data were obtained on a monthly basis at three additional sites in lower Delaware Bay (sites U-W on fig. 6). Water samples were analyzed for selected physical properties and chemical constituents.
Data obtained from the water-quality monitors are processed and stored in the USGS National Water Information System data base. These data are published annually by the USGS in water resources data reports for New Jersey and Pennsylvania. Water-quality data for the other sampling sites are not presented in this report but are available from DRBC and STORET, an environmental-quality database operated by the U.S. Environmental Protection Agency.
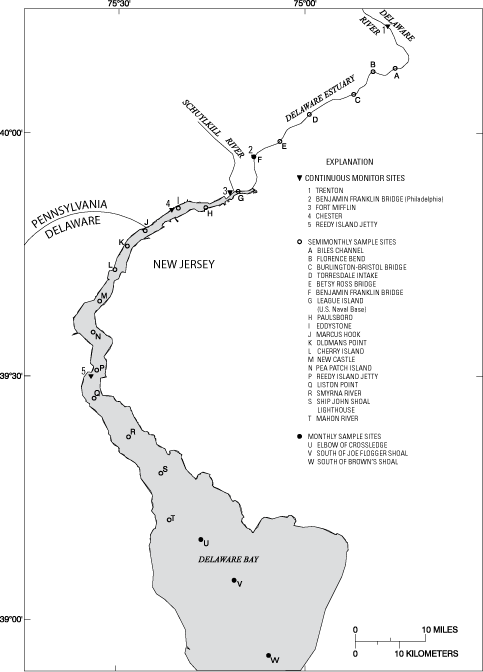
Figure 6. Location of water-quality monitoring sites on the Delaware Estuary.
Streamflow has a major effect on the quality of water in the Delaware Estuary. High freshwater flows commonly result in improved water quality by limiting the upstream movement of seawater and reducing the concentration of dissolved substances. High flows also aid in maintaining lower water temperatures during warm weather and in supporting higher concentrations of dissolved oxygen. Under certain conditions, however, high streamflows can transport large quantities of nutrients to the estuary, which may result in algal blooms. Streamflow from the Delaware River Basin above Trenton, New Jersey, is the major source of freshwater inflow to the Delaware Estuary. During the report year, monthly mean streamflow measured at the USGS gaging station Delaware River at Trenton, New Jersey, was highest during May 2002 (20,240 ft3/s) and lowest during August (3,253 ft3/s; table 17). Monthly mean streamflows were greater than long-term mean monthly flows in May, June, October, and November and less than the long-term flows in the other 8 months. The greatest percentage flow deficiency was in January 2002, when monthly mean streamflow was about 28 percent of the long-term mean monthly flow. Long-term monthly mean streamflow was computed on the basis of data for the period from 1913 to 2001. The highest daily mean streamflow during the report year was 41,800 ft3/s on May 15, 2002. The lowest daily mean streamflow was 2,480 ft3/s on January 21, 2002.
Water temperature has an important influence on water quality, because it affects various physical, chemical, and biological properties of water. Generally, increases in water temperature have detrimental effects on water quality by decreasing the saturation level of dissolved oxygen and increasing the biological activity of aquatic organisms. Although the primary factors that affect water temperature in the Delaware Estuary are climatic, various kinds of water use, especially powerplant cooling, also can have important effects.
At the Benjamin Franklin Bridge, Philadelphia, Pennsylvania, monthly mean water temperatures during the report year were greater than the long-term mean monthly temperatures in all months except January, May, June, and November, 2002. Long-term mean water temperatures were computed using data for the period from 1964 to 2001 (fig. 7). The maximum daily mean water temperature of 28.5°C was recorded on August 4, 5, 20, and 21, 2002.
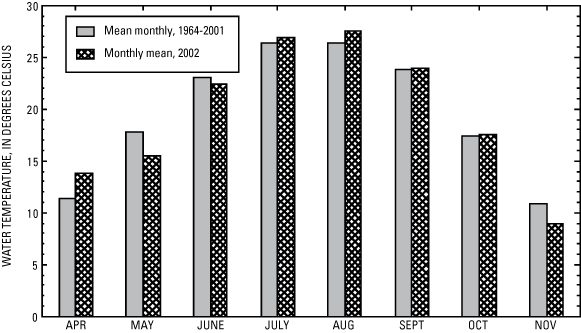
Figure 7. Water temperature in the Delaware Estuary at Benjamin Franklin Bridge at Philadelphia, Pennsylvania, April to November.
Specific conductance is a measure of the capacity of water to conduct an electrical current and is a function of the types and quantities of dissolved substances in water. As concentrations of dissolved ions increase, specific conductance of the water increases. Specific conductance measurements are good indicators of dissolved solids content and total ion concentrations. Seawater and some man-made constituents can cause the specific conductance of estuary water to increase substantially. Dilution associated with high streamflows results in decreased levels of dissolved solids and lower specific conductance whereas low streamflows have the opposite effect.
The upstream movement of seawater and the accompanying increase in chloride concentrations is an important concern for water supplies obtained from the Delaware Estuary. Water with chloride concentrations greater than 250 mg/L (milligrams per liter) is considered undesirable for domestic use, and water with concentrations exceeding 50 mg/L is unsatisfactory for some industrial processes. Chloride concentrations in the estuary increase in a downstream direction, with proximity to the Atlantic Ocean.
Chloride concentration was not measured directly at the monitor sites at Fort Mifflin, Pennsylvania, and Reedy Island Jetty, Delaware. Instead, a mathematical relation between specific conductance and chloride concentration has been developed on the basis of long-term field measurements of specific conductance and laboratory analyses of chloride; this relation can be used to estimate chloride concentrations from specific conductance values. Chloride concentrations estimated from the relation are presented in tables 18 and 20. The specific conductance-chloride relation is less reliable when chloride concentrations are less than 30 mg/L, because other dissolved ions may be present in amounts large enough to affect the relation. Therefore, chloride concentrations estimated from specific conductance data are not presented when concentrations of less than 30 mg/L would result from the relation. Instead, estimated values less than 30 mg/L are reported as <30 mg/L. Chloride concentrations at Chester, Pennsylvania (table 19) were measured directly by Kimberly Clark Chester Operations and are not derived from specific conductance data.
At Fort Mifflin, the highest daily maximum chloride concentration during the report year was 310 mg/L on September 26 (table 18). Daily maximum concentrations exceeded 50 mg/L on 37 percent of the days. The lowest daily minimum chloride concentration was less than 30 mg/L on many days during the report year. Daily minimum concentrations exceeded 50 mg/L on 22 percent of the days. From March to July, the daily minimum chloride concentration was less than 30 mg/L on most days, and the highest daily maximum concentration was 80 mg/L. In September and October, daily minimum chloride concentrations ranged from less than 30 to 240 mg/L, and daily maximum concentrations ranged from less than 30 to 310 mg/L.
At Chester, the highest daily maximum chloride concentration was 1,200 mg/L on September 27, 2002 (table 19). During the report year, daily maximum concentrations exceeded 50 mg/L on 57 percent of the days. The lowest daily minimum chloride concentration was 19 mg/L on May 23. Daily minimum concentrations exceeded 50 mg/L on 54 percent of the days. Chloride concentrations were persistently high from December 1, 2001, to March 11, 2002, and from July 25 to October 18, when daily minimum concentrations exceeded 50 mg/L on all days.
At Reedy Island Jetty, the highest daily maximum chloride concentration was 8,500 mg/L on September 3, 2002 (table 20). Daily maximum chloride concentrations during the report year exceeded 1,000 mg/L on 99.7 percent of the days. The lowest daily minimum chloride concentration for the report year was 91 mg/L on May 18, 2002. Daily minimum chloride concentrations exceeded 1,000 mg/L on 77 percent of the days. From December to May, daily maximum chloride concentrations at Reedy Island Jetty ranged from 990 to 7,700 mg/L. From May to November, daily maximum chloride concentrations ranged from 1,200 to 8,500 mg/L.
Dissolved oxygen in water is necessary for the respiratory processes of aquatic organisms and in chemical reactions in aquatic environments. Fish and many other clean-water species require relatively high dissolved oxygen concentrations at all times. The major source of dissolved oxygen in the Delaware Estuary is diffusion from the atmosphere, and, to a lesser extent, photosynthetic activity of aquatic plants. The principal factors that affect dissolved oxygen concentrations in the estuary are water temperature, biochemical oxygen demand, freshwater inflow, phytoplankton, turbidity, salinity, and tidal- and wind-driven mixing.
Concentrations of dissolved oxygen at several sites on the Delaware Estuary have been measured since 1962 by the USGS. Two of these sites, Delaware River at Benjamin Franklin Bridge at Philadelphia, Pennsylvania, and Delaware River at Chester, Pennsylvania, have nearly continuous records and are in the reach of the estuary most affected by effluent discharges. The mean and minimum daily mean dissolved oxygen concentrations from July to September at these stations during the 1965-2002 report years is shown in figure 8. An increasing trend in concentration is evident. Although concentrations have increased considerably over this 38-year period, mean concentrations can vary substantially from year to year.
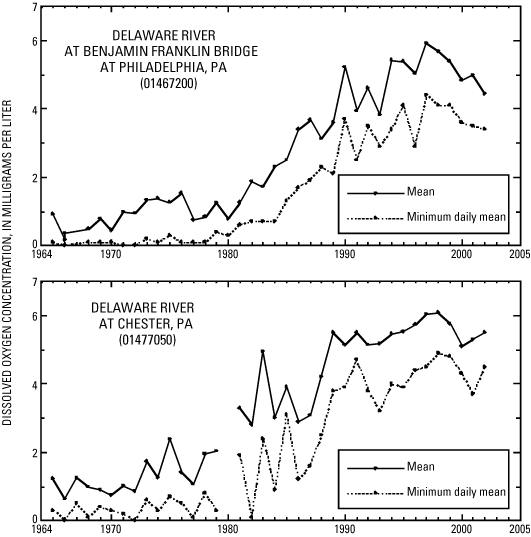
Figure 8. Mean and minimum daily mean dissolved oxygen concentrations from July to September at two monitor sites on the Delaware Estuary, 1965-2002.
Concentrations of dissolved oxygen in the Delaware Estuary generally are greatest near Trenton and decrease in a downstream direction. In an area just below the Benjamin Franklin Bridge, concentrations usually reach minimum levels. During the report year, daily mean concentrations of dissolved oxygen at the Benjamin Franklin Bridge monitor site were lowest in late August, and the lowest recorded daily mean concentration was 3.4 mg/L on August 27 (table 21). Daily mean concentrations of dissolved oxygen were consistently 6.0 mg/L or greater on most days from April 1 to June 12 and from October 14 to November 30, 2002. At Chester, daily mean dissolved oxygen concentrations were lowest during late June and early July and the lowest recorded daily mean concentration was 4.4 mg/L on June 22 (table 22).
Histograms of hourly dissolved oxygen concentrations at the Benjamin Franklin Bridge and Chester monitor sites during the critical summer periodJuly to September 2002are presented in figure 9. Hourly concentrations at the Benjamin Franklin Bridge were 4 mg/L or less during 39 percent of this period. In comparison, in 2001, hourly concentrations decreased to levels 4 mg/L or less during 6 percent of the critical period. At Chester, hourly dissolved oxygen concentrations were 4 mg/L or less during 0.74 percent of the 2002 critical summer period. In 2001, hourly concentrations decreased to levels of 4 mg/L or less during 6 percent of the critical period. Dissolved oxygen concentrations less than 4 mg/L can have adverse, and possibly lethal, effects on fish and other aquatic organisms.
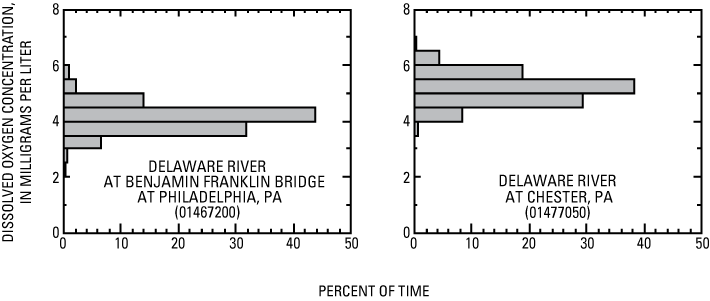
Figure 9. Distribution of hourly dissolved oxygen concentrations at two monitor sites on the Delaware Estuary, July to September 2002.
The pH of a solution is a measure of the effective concentration (activity) of dissolved hydrogen ions. Solutions with pH less than 7 are characterized as acidic whereas solutions with pH greater than 7 are considered basic or alkaline. The pH of uncontaminated surface water generally ranges from 6.5 to 8.5. Major factors affecting the pH of surface water include the geologic composition of the drainage basin and human inputs including wastewater discharges. In addition, photosynthetic activity, and dissolved gases including carbon dioxide, hydrogen sulfide, and ammonia can have a considerable effect on pH. During the report year, pH was measured seasonally at the Benjamin Franklin Bridge and Chester monitor sites, and continuously at the Reedy Island Jetty site. The range of median pH for these stations is as follows: Benjamin Franklin Bridge, 6.6 to 7.4; Chester, 6.7 to 7.4; and Reedy Island Jetty, 7.0 to 7.9. Generally, the pH of water in the Delaware Estuary is lowest near Trenton, New Jersey, and increases (that is, becomes more alkaline) in a downstream direction.
Table 17. Daily mean discharge, Delaware River at Trenton, New Jersey (station number 01463500) for year ending November 30, 2002
Table 18. Daily maximum and minimum chloride concentraitons estimated from values of specific conductance, Delaware River at Fort Miflin, Pennsylvania (station number 01474703) for year ending November 30, 2002
Table 19. Daily maximum and minimum chloride concentrations, Delaware River at Chester, Pennsylvania (station number 01477050) for year ending November 30, 2002
Table 20. Daily maximum and minimum chloride concentrations estimated from values of specific conductance, Delaware River at Reedy Island Jetty, Delaware (station number 01482800) for year ending November 30, 2002
Table 21. Daily mean dissolved oxygen concentration, Delaware River at Benjamin Franklin Bridge at Philadelphia, Pennsylvania (station number 01467200) for year ending November 30, 2002
Table 22. Daily mean dissolved oxygen concentration, Delaware River at Chester, Pennsylvania (station number 01477050) for year ending November 30, 2002
NO. 2001-32
A RESOLUTION pursuant to Articles 3.3 and 10.4 of the Delaware River Basin Compact to preserve and protect water supplies in the Delaware River Basin.
WHEREAS, on December 1, 2001, the storage criterion set forth in Commission Resolution No. 83-13 for New York Citys Delaware River Basin reservoirs triggered drought operations in accordance with the schedule of releases and diversions in the Commissions drought operating plan, and
WHEREAS, in accordance with Resolution 83-13, when the storage criterion is met, it is the policy of the Commission to declare a drought emergency for purposes of imposing appropriate conservation measures, and
WHEREAS, the states of New Jersey, New York, and Pennsylvania have issued drought warnings for counties within the Delaware River Basin and have called for voluntary water conservation by all users, and
WHEREAS, the Commissions drought operating plan complements the states drought operation by addressing the essential conservation of regional reservoir storage for purposes of water supply and flow augmentation for the Delaware River and salinity control in the Delaware Estuary, and
WHEREAS, a declaration of drought emergency by the Commission is required for the full implementation of water conserving provisions of its drought operating plan and to preserve and protect the regional water supply in the Basin; now therefore,
BE IT RESOLVED by the Delaware River Basin Commission
| BY THE COMMISSION |
ADOPTED:
AGREEMENT
The Parties to the U.S. Supreme Court Decree hereby agree to amendment of the conditions of Delaware River Basin Commission Resolution No. 83-13 and Docket D-77-20 CP (Revision 4) for the purpose of emergency protection of tailwater fisheries, as follows:
| When Trenton Flow Equals or Exceeds |
Maximum Daily Credit Reduction |
|---|---|
| 3500 cfs | 100 cfs |
| 3300 cfs | 50 cfs |
December 19, 2001
| State of Delaware | Date |
| State of New Jersey | Date |
| State of New York | Date |
| Commonwealth of Pennsylvania | Date |
| City of New York | Date |
No. 2002-6
EXTENSION OF DOCKET NO. 77-20 CP (Revision 5)
DELAWARE RIVER BASIN COMMISSION
A RESOLUTION to extend Docket No. D-77-20 CP (Revision 4) for one year to continue the experimental augmented conservation release program for the New York City Delaware Basin Reservoirs, and to amend Docket No. D-77-20 CP (Revision 4) to establish a temporary habitat bank for support of experimental flow targets for fisheries protection on the West Branch of the Delaware River at Hale Eddy, and to temporarily modify the conservation releases from Cannonsville Reservoir.
WHEREAS, Document No. 77-20 CP (Revision 4) specified the current augmented experimental release program and instituted a drought watch and a revised drought warning level for the three New York City Delaware Basin Reservoirs beginning in May 1999 and ending on April 30, 2001; and
WHEREAS, Resolution No. 2001-5 extended Docket No. 77-20 CP (Revision 4) for one calendar year ending on April 30, 2002, and
WHEREAS, Docket No. D-77 CP (Revision 4) condition h. provides for an extension of the provisions of this Docket upon agreement of all parties to the 1954 Supreme Court Decree; and
WHEREAS, the parties to the 1954 Supreme Court Decree are in the process of negotiating a permanent fisheries release program more responsive to the water conditions downstream of New York City Delaware Basin Reservoirs; and
WHEREAS, agreement on the permanent fisheries release program is not expected prior to April 30, 2002, the date at which the current program will automatically terminate; and
WHEREAS, the State of New York has proposed a revision and extension to Docket No. D-77-20 CP (Revision 4) for one calendar year ending April 30, 2003; and
WHEREAS, the requested revision and extension has been agreed to by all parties to the 1954 Supreme Court Decree;
BE IT RESOLVED by the undersigned Commissioners and Parties to the Decree:
| /S/ Col. John P. Carroll Col. John P. Carroll, Chairman pro tem | |
| /S/ Pamela M. Bush Pamela M. Bush, Esq., Commission Secretary |
ADOPTED: April 3, 2002
AGREEMENT TO RESERVE THE EXCESS-RELEASE
QUANTITY DURING THE 2002-2003 SEASONAL PERIOD
As a result of deficient precipitation in the upper Delaware River Basin, storage in the New York City reservoirs is below average for this time of year. Current storage in the New York City Delaware River Basin reservoirs is about 46 billion gallons above the drought watch line and about 28 billion gallons below median.
To conserve the waters of the Delaware River Basin, one-half of the excess-release quantity for the 2002-2003 seasonal period will be suspended. This action was agreed upon by the Parties to the Decree in a June 10, 2002 conference call initiated by the Delaware River Masters office. Suspension of the excess-release quantity will take effect on June 15, 2002 and will continue until March 15, 2003 unless modified by unanimous agreement of the Decree Parties.
| State of Delaware | Date | State of Delaware | Date |
| State of New Jersey | Date | Commonwealth of Pennsylvania | Date |
| State of New York | Date | City of New York | Date |
No. 2002-21
EXTENSION OF DOCKET NO. 77-20 CP (Revision 5) (Amended)
DELAWARE RIVER BASIN COMMISSION
A RESOLUTION to extend Docket No. D-77-20 CP (Revision 4) for one year to continue the experimental augmented conservation release program for the New York City Delaware Basin Reservoirs, and to amend Docket No. D-77-20 CP (Revision 4) to establish a temporary habitat bank for support of experimental flow targets for fisheries protection on the West Branch of the Delaware River at Hale Eddy, and to temporarily modify the conservation releases from Cannonsville Reservoir.
WHEREAS, Document No. 77-20 CP (Revision 4) specified the current augmented experimental release program and instituted a drought watch and a revised drought warning level for the three New York City Delaware Basin Reservoirs beginning in May 1999 and ending on April 30, 2001; and
WHEREAS, Resolution No. 2001-5 extended Docket No. 77-20 CP (Revision 4) for one calendar year ending on April 30, 2002, and
WHEREAS, Docket No. D-77-20 CP (Revision 4) condition h. provides for an extension of the provisions of this docket upon agreement of all Parties to the 1954 Supreme Court Decree; and
WHEREAS, the Parties in the 1954 Supreme Court Decree are in the process of negotiating a permanent fisheries release program more responsive to the water conditions downstream of New York City Delaware Basin Reservoirs; and
WHEREAS, agreement on the permanent fisheries release program is not expected prior to April 30, 2002, the date at which the current program will automatically terminate; and
WHEREAS, the State of New York has proposed a revision and extension to Docket No. D-77-20 CP (Revision 4) for one calendar year ending April 30, 2003; and
WHEREAS, the requested revision and extension has been agreed to by all Parties to the 1954 Supreme Court Decree; now therefore,
BE IT RESOLVED by the undersigned Commissioners and Parties to the Decree:
| /S/ Irene B. Brooks Irene B. Brooks, Chairman pro tem | |
| /S/ Pamela M. Bush Pamela M. Bush, Esq., Commission Secretary |
ADOPTED: July 17, 2002
No. 2002-31
A RESOLUTION to terminate the drought emergency that was declared by Resolution No. 2001-32 on December 18, 2001 and extended by Resolution No. 2002-25 on October 16, 2002.
WHEREAS, by Resolution No. 2002-25 on October 16, 2002, due to continued poor hydrologic conditions throughout the basin, the Commissioners extended through November 25, 2002 the drought emergency it declared in December 2001; and
WHEREAS, the hydrology of the Delaware River Basin has improved, due to above-normal precipitation during the months of September, October, and November. Evidence of improved conditions includes the following:
WHEREAS, the State of Delaware and the City of New York have terminated their respective drought emergencies; and
WHEREAS, Pennsylvania has terminated its drought emergency in all but two of the counties within the basin, and New Jersey has relaxed its statewide non-essential water use restrictions in the northern and central portions of the state; and
WHEREAS, in spite of the improved conditions in most parts of the basin, ground water levels in the southern portion of New Jersey as well as in Chester and Delaware counties in Pennsylvania remain below normal, and state-imposed mandatory use restrictions remain in place in these locations, and
WHEREAS, during the drought watch, warning and emergency to date, the Commission directed releases totaling 11.5 billion gallons from regional reservoirs in Pennsylvania and reduced diversions by the City of New York and the State of New Jersey, thereby maintaining flows in the main stem and conserving 43 billion gallons of water in New York Citys Delaware Basin water supply reservoirs; now therefore,
BE IT RESOLVED by the Delaware River Basin Commission:
| /S/ Irene B. Brooks Irene B. Brooks, Chairman pro tem | |
| /S/ Pamela M. Bush Pamela M. Bush, Esq., Commission Secretary |
ADOPTED: November 25, 2002
This report is available online in Portable Document Format (PDF). If you do not have the Adobe Acrobat PDF Reader, it is available for free download from Adobe Systems Incorporated.
Download the report (PDF, 4.3MB)
Document Accessibility: Adobe Systems Incorporated has information about PDFs and the visually impaired. This information provides tools to help make PDF files accessible. These tools convert Adobe PDF documents into HTML or ASCII text, which then can be read by a number of common screen-reading programs that synthesize text as audible speech. In addition, an accessible version of Acrobat Reader 5.0 for Windows (English only), which contains support for screen readers, is available. These tools and the accessible reader may be obtained free from Adobe at Adobe Access.

![]() U.S. Department of the Interior | U.S. Geological Survey
U.S. Department of the Interior | U.S. Geological Survey
Persistent URL: http://pubs.water.usgs.gov/ofr2006-1220
Page Contact Information: USGS Publishing Network
Page Last Modified: 15-Mar-2007 15:13:44 EDT