Report Site Map > Discussion of Net Nutrient Flux for Five Large Subbasins Comprising the Mississippi-Atchafalaya River Basin
Average annual net nutrient fluxes and streamflow are provided for 5-year intervals for the five large subbasins comprising the Mississippi-Atchafalaya River Basin (MARB). The data are averaged for 5-year intervals. This improves the interpretability of the results by removing some of the year-to-year variability in flux, which is due to the year-to-year variability in stream runoff and random error. These variabilities tend to cancel out when averaging over the 5-year interval. Average annual net nutrient fluxes for the Lower Mississippi and Upper Mississippi subbasins are calculated as a difference between fluxes from two or more stations, which results in larger errors compared to the error for the other three subbasins for which nutrient fluxes are either estimated from an individual station or as the sum of fluxes from multiple stations. These larger errors occur because the resulting net nutrient fluxes are small differences between much larger numbers and by the rules for calculating confidence intervals for differences. The Lower Mississippi subbasin has the largest confidence intervals because net fluxes are calculated as a combination of flux estimates from six stations and because the resulting net fluxes are small compared to the component fluxes. The Lower Mississippi is the smallest subbasin, accounting for only 5.8 percent of the total drainage area of the MARB.
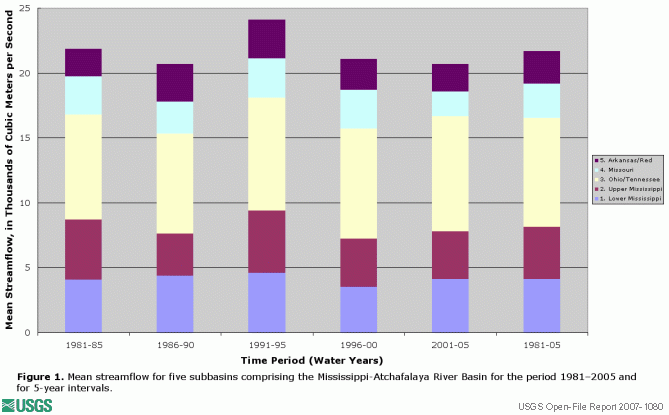
The contribution of runoff from each of the five subbasins and their variability over time is illustrated in figure 1. The Lower Mississippi and Ohio/Tennessee subbasins provide a proportionally larger contribution of runoff with respect to the relative size of their drainage area (table 1), which is largely the result of higher annual rainfall in these subbasins. The Missouri subbasin provides a much smaller contribution of runoff with respect to its drainage area, providing 12.3 percent of the MARB runoff while encompassing 43.1 percent of the MARB drainage area.
|
|
Most of the net flux of dissolved nitrite plus nitrate from the MARB is from the Upper Mississippi and Ohio/Tennessee subbasins (fig. 2), representing 43 percent and 35 percent of total MARB flux for the 1981–2005 period, respectively. Likewise, most of the net flux of total nitrogen is from the the Upper Mississippi and Ohio/Tennessee subbasins (fig. 3), representing 39 percent and 34 percent of the total MARB flux for the 1981–2005 period, respectively. Generally, dissolved nitrite plus nitrate makes up about two-thirds of the total nitrogen flux.
Note that a negative net flux is observed for the Lower Mississippi subbasin for the water year 1991–95 time period (fig. 2). The confidence intervals for net fluxes are quite large for the Lower Mississippi subbasin, for reasons mentioned above. Hence, it is not possible to discern whether the negative net flux was due to errors in the flux estimates used to calculate the net flux, or if there really was a real net loss of dissolved nitrite plus nitrate in the subbasin during this time period.
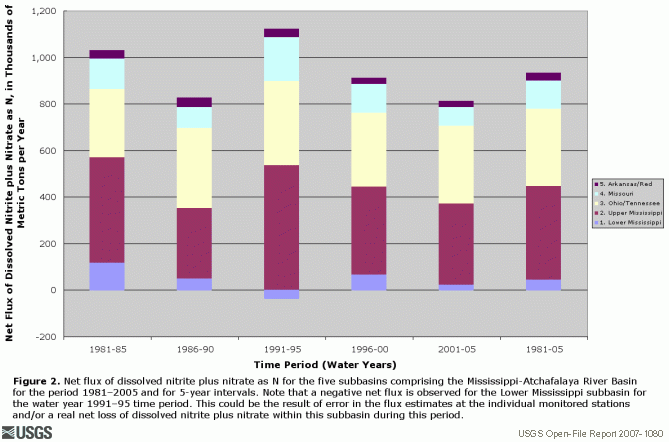 Figure 2. Net flux of dissolved nitrite plus nitrate for the five subbasins comprising the Mississippi-Atchafalaya River Basin for the period 1981–2005 and for 5-year intervals. Note that a negative net flux is observed for the Lower Mississippi subbasin for the water year 1991–95 time period. This could be the result of error in the flux estimates at the individual monitored stations and/or a real net loss of dissolved nitrite plus nitrate within this subbasin during this period. |
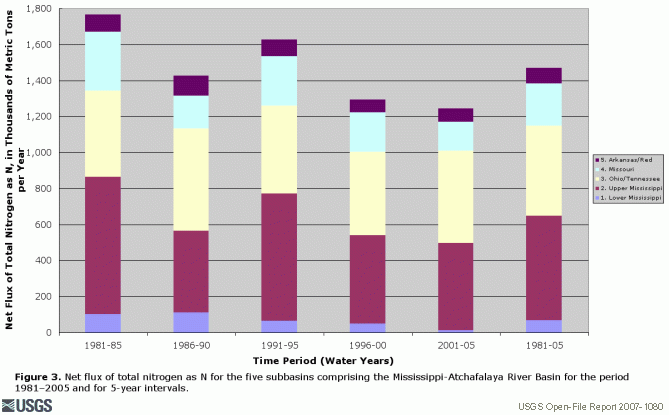 Figure 3. Net flux of total nitrogen as N for the five subbasins comprising the Mississippi-Atchafalaya River Basin for the period 1981–2005 and for 5-year intervals. |
| Click on graphs for larger versions. |
Average annual net yields of dissolved nitrite plus nitrate and total nitrogen (fluxes per unit drainage area) are shown in figures 4 and 5. Net nitrogen yields for the Upper Mississippi and Ohio/Tennessee subbasins were about twice as high as the yields for the entire MARB. Overall net nitrogen yields for the Lower Mississippi subbasin were similar to the yields for the entire MARB. Net nitrogen yields for the Missouri and Arkansas/Red subbasins were less than half of the yields for the entire MARB. Variability in nitrogen yields in the Upper Mississippi subbasin reflects variations in runoff, with higher yields during periods of higher runoff (1981–1985 and 1991–1995) and lower yields during the period of lower runoff (1986–1990; fig. 1). Variability in dissolved nitrite plus nitrate yields in the Lower Mississippi subbasin are likely due to the large errors for this subbasin.
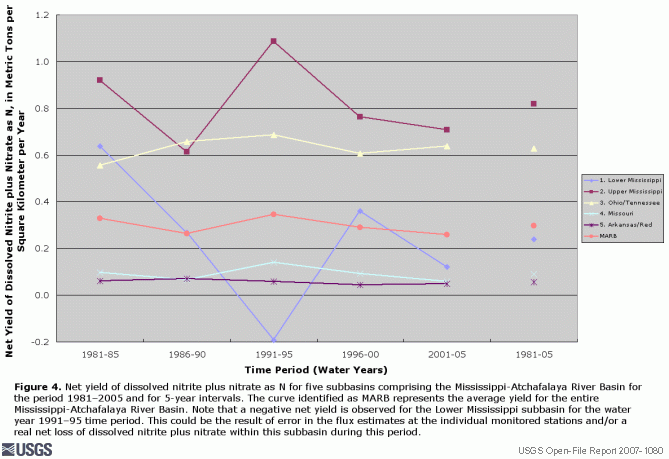 Figure 4. Net yield of dissolved nitrite plus nitrate for five subbasins comprising the Mississippi-Atchafalaya River Basin for the period 1981–2005 and for 5-year intervals. The curve identified as MARB represents the average yield for the entire Mississippi-Atchafalaya River Basin. Note that a negative net yield is observed for the Lower Mississippi subbasin for the water year 1991–95 time period. This could be the result of error in the flux estimates at the individual monitored stations and/or a real net loss of dissolved nitrite plus nitrate within this subbasin during this period. |
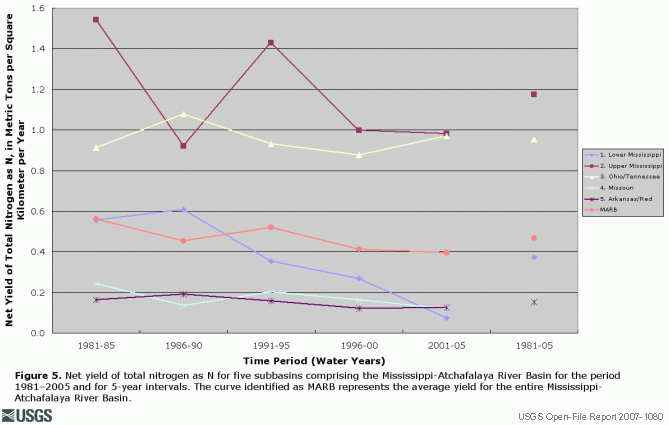 Figure 5. Net yield of total nitrogen for five subbasins comprising the Mississippi-Atchafalaya River Basin for the period 1981–2005 and for 5-year intervals. The curve identified as MARB represents the average yield for the entire Mississippi-Atchafalaya River Basin. |
| Click on graphs for larger versions. |
Most of the MARB net flux of total phosphorus for the period 1981–2005 is from three subbasins, the Ohio/Tennessee, the Upper Mississippi, and the Missouri (31 percent, 27 percent, and 21 percent, respectively; fig. 6). The Lower Mississippi, Ohio/Tennessee, and Upper Mississippi subbasins have total phosphorus yields that are about twice the yield of the entire MARB (fig. 7). The Missouri and Arkansas/Red subbasins have total phosphorus yields of about one-half of the yield of the entire MARB.
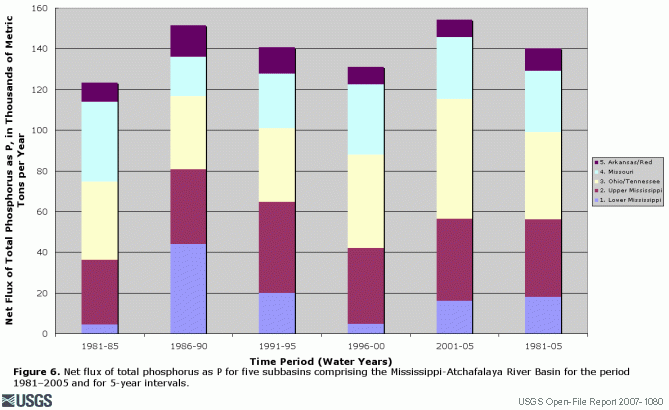 Figure 6. Net flux of total phosphorus for five subbasins comprising the Mississippi-Atchafalaya River Basin for the period 1981–2005 and for 5-year intervals. |
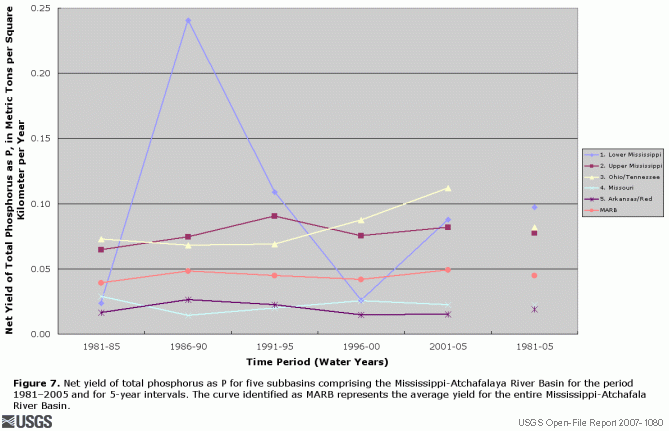 Figure 7. Net yield of total phosphorus for five subbasins comprising the Mississippi-Atchafalaya River Basin for the period 1981–2005 and for 5-year intervals. The curve identified as MARB represents the average yield for the entire Mississippi-Atchafalaya River Basin. |
| Click on graphs for larger versions. |
Report Site Map > Discussion of Net Nutrient Flux for Five Large Subbasins Comprising the Mississippi-Atchafalaya River Basin

![]() U.S. Department of the Interior |
U.S. Geological Survey
U.S. Department of the Interior |
U.S. Geological Survey
URL: http://pubsdata.usgs.gov/pubs/of/2007/1080/of-2007-1080/discussion_5large_basins.html
Page Contact Information: GS Pubs Web Contact
Page Last Modified: Wednesday, 05-Mar-2025 14:49:01 EST