Report Site Map > Graphics of Streamflow and Nutrient Flux > Graphics of Streamflow and Nutrient Flux Delivered from the Mississippi-Atchafalaya River Basin to the Gulf of Mexico > Graphics of Streamflow and Nutrient Flux for the Mississippi-Atchafalaya River Basin to the Gulf of Mexico
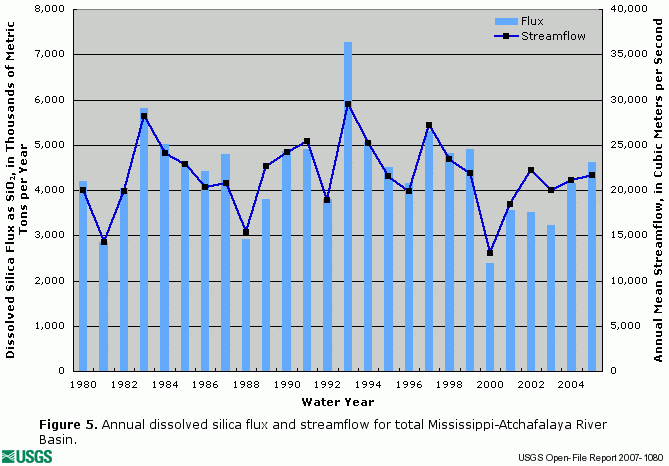
The following graphs depict annual flux of dissolved nitrite plus nitrate (figure 1), total nitrogen (figure 2), total phosphorus (figure 3), dissolved orthophosphate (figure 4), and dissolved silica (figure 5), along with concurrent annual streamflow delivered to the Gulf of Mexico by the Mississippi-Atchafalaya River Basin. Graphs of nutrient flux and streamflow for the Mississippi River near St. Francisville, Louisiana, and the Lower Atchafalaya River at Melville, Louisiana, are also available on separate pages.
| Click on graphs for larger versions. |
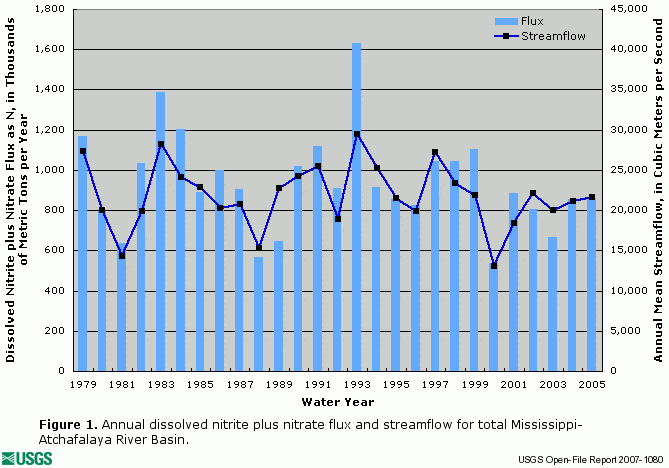 Figure 1. Annual dissolved nitrite plus nitrate flux and streamflow for total Mississippi-Atchafalaya River Basin. |
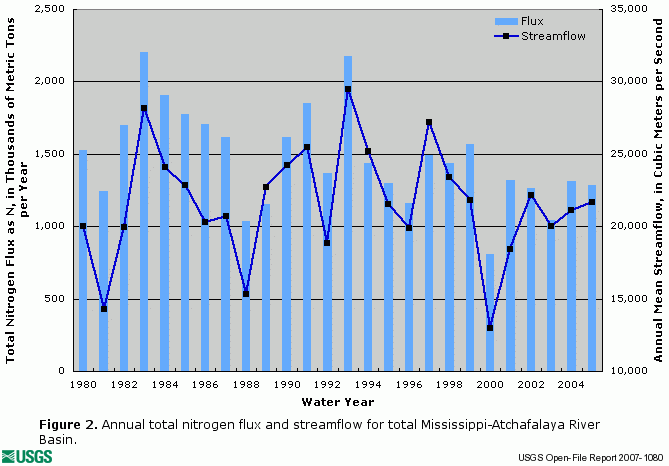 Figure 2. Annual total nitrogen flux and streamflow for total Mississippi-Atchafalaya River Basin. |
|
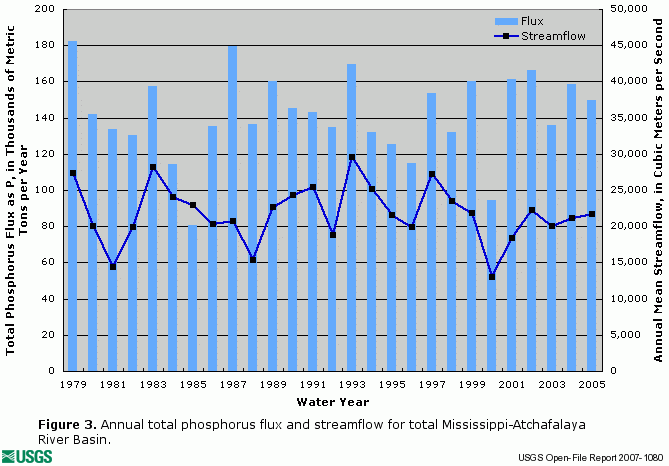 Figure 3. Annual total phosphorus flux and streamflow for total Mississippi-Atchafalaya River Basin. |
 Figure 4. Annual dissolved orthophosphate flux and streamflow for total Mississippi-Atchafalaya River Basin. |
|
|
||
| Click on graphs for larger versions. |
The data used to generate the above graphs are available on the following page.
The U.S. Geological Survey defines a water year as October 1st of the previous year to September 30th of the designated year; for example, water year 2005 is from October 1st, 2004 to September 30th, 2005.
Report Site Map > Graphics of Streamflow and Nutrient Flux > Graphics of Streamflow and Nutrient Flux Delivered from the Mississippi-Atchafalaya River Basin to the Gulf of Mexico > Graphics of Streamflow and Nutrient Flux for the Mississippi-Atchafalaya River Basin to the Gulf of Mexico

![]() U.S. Department of the Interior |
U.S. Geological Survey
U.S. Department of the Interior |
U.S. Geological Survey
URL: http://pubsdata.usgs.gov/pubs/of/2007/1080/of-2007-1080/graphics/delivery_graphics/annual_graphics.html
Page Contact Information: GS Pubs Web Contact
Page Last Modified: Thursday, 06-Mar-2025 11:55:04 EST