Report Site Map > Graphics of Streamflow and Nutrient Flux > Graphics for Streamflow and Nutrient Flux for the Nine Major Subbasins Comprising the Mississippi-Atchafalaya River Basin > Graphics of Streamflow and Nutrient Flux for the Red River at Alexandria, Louisiana
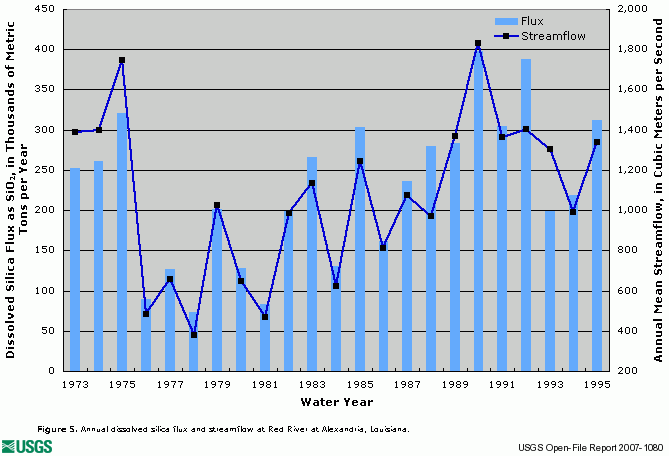
The following graphics depict annual flux of dissolved nitrite plus nitrate (figure 1), total nitrogen (figure 2), total phosphorus (figure 3), dissolved orthophosphate (figure 4), and dissolved silica (figure 5), along with concurrent annual streamflow for the Red River at Alexandria, Louisiana (Station ID 07355500).
| Click on graphs for larger versions. |
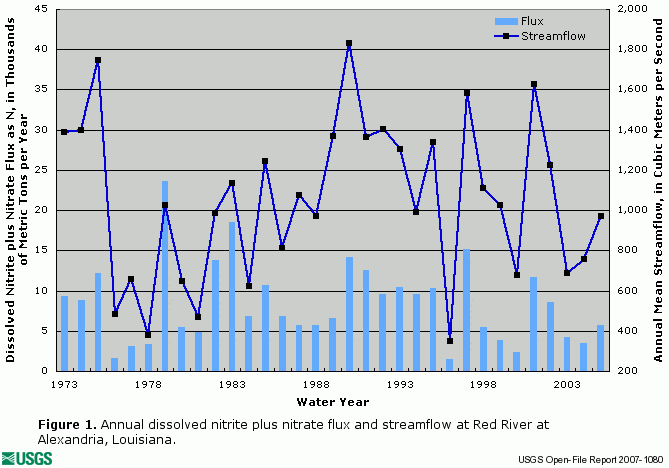 Figure 1. Annual dissolved nitrite plus nitrate flux and streamflow at Red River at Alexandria, Louisiana. |
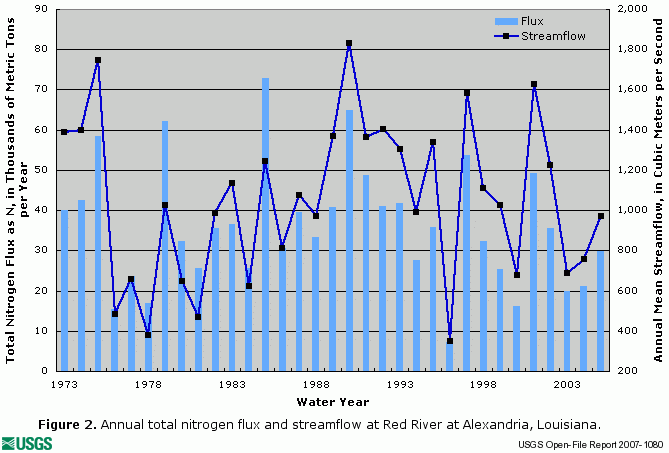 Figure 2. Annual total nitrogen flux and streamflow at Red River at Alexandria, Louisiana. |
|
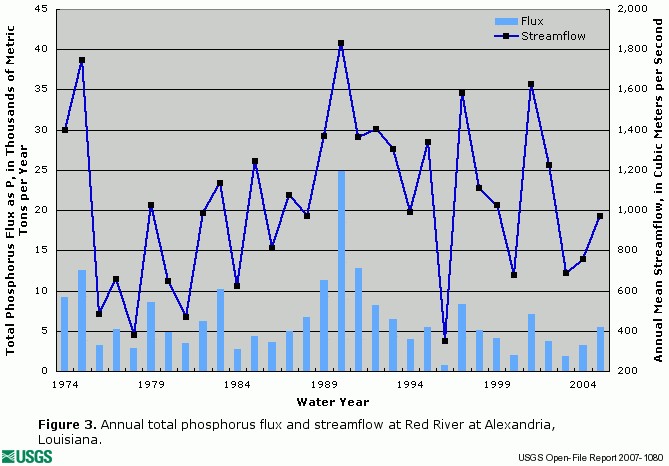 Figure 3. Annual total phosphorus flux and streamflow at Red River at Alexandria, Louisiana. |
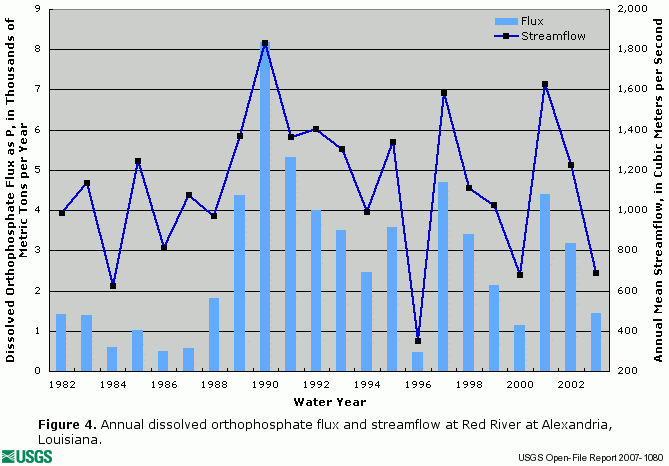 Figure 4. Annual dissolved orthophosphate flux and streamflow at Red River at Alexandria, Louisiana. |
|
|
||
| Click on graphs for larger versions. |
The data used to generate the above graphs are available on the following page.
Report Site Map > Graphics of Streamflow and Nutrient Flux > Graphics for Streamflow and Nutrient Flux for the Nine Major Subbasins Comprising the Mississippi-Atchafalaya River Basin > Graphics of Streamflow and Nutrient Flux for the Red River at Alexandria, Louisiana

![]() U.S. Department of the Interior |
U.S. Geological Survey
U.S. Department of the Interior |
U.S. Geological Survey
URL: http://pubsdata.usgs.gov/pubs/of/2007/1080/of-2007-1080/graphics/flux_graphics/RED-ALEX_graphics.html
Page Contact Information: GS Pubs Web Contact
Page Last Modified: Monday, 24-Mar-2025 13:39:23 EDT