Report Site Map > Graphics of Streamflow and Nutrient Flux > Graphics for Streamflow and Nutrient Flux for Selected Mississippi River Sub-basins with Varied Sizes, Hydrology, Land Use, and Geographic Location > Graphics of Streamflow and Nutrient Flux for the Tennessee River at Highway 60 near Paducah, Kentucky
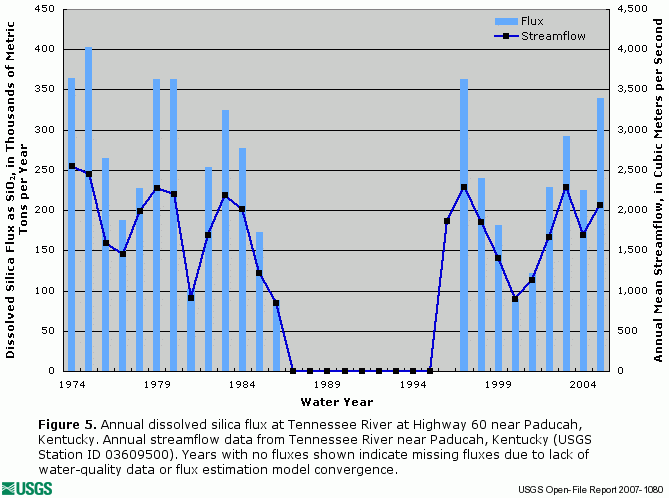
The following graphics depict annual flux of dissolved nitrite plus nitrate (figure 1), total nitrogen (figure 2), total phosphorus (figure 3), dissolved orthophosphate (figure 4), and dissolved silica (figure 5), along with concurrent annual streamflow for the Tennessee River at Highway 60 near Paducah, Kentucky (Station ID 03609750).
| Click on graphs for larger versions. |
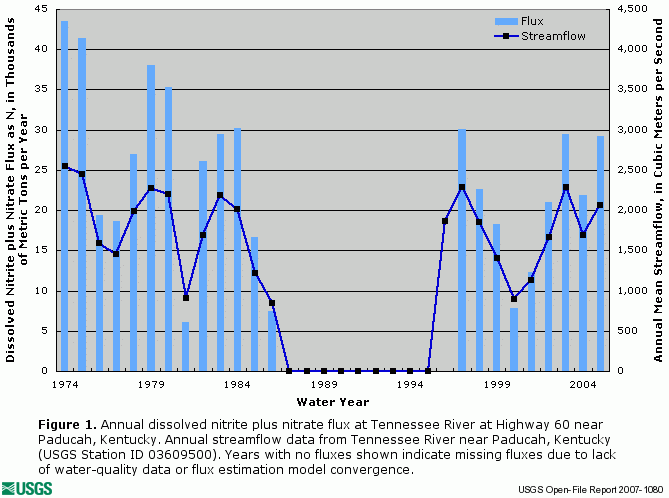 Figure 1. Annual dissolved nitrite plus nitrate flux at Tennessee River at Highway 60 near Paducah, Kentucky. Annual streamflow data from Tennessee River near Paducah, Kentucky (USGS Station ID 03609500). Years with no fluxes shown indicate missing fluxes due to lack of water-quality data or flux estimation model convergence. |
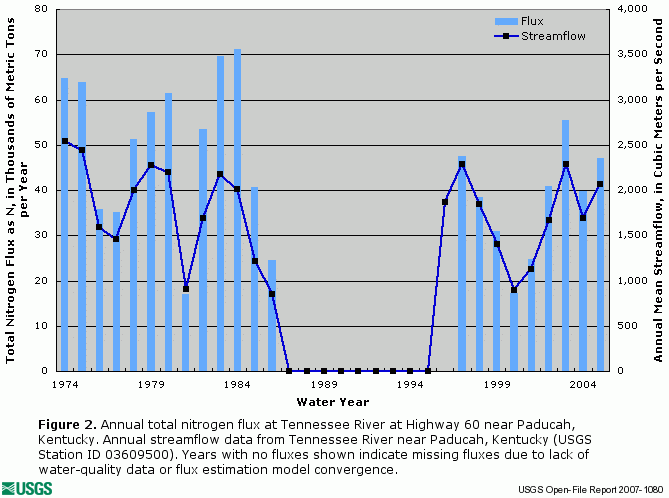 Figure 2. Annual total nitrogen flux at Tennessee River at Highway 60 near Paducah, Kentucky. Annual streamflow data from Tennessee River near Paducah, Kentucky (USGS Station ID 03609500). Years with no fluxes shown indicate missing fluxes due to lack of water-quality data or flux estimation model convergence. |
|
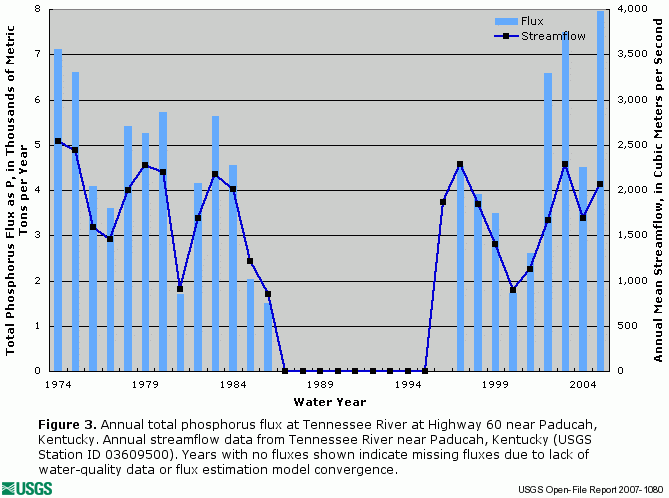 Figure 3. Annual total phosphorus flux at Tennessee River at Highway 60 near Paducah, Kentucky. Annual streamflow data from Tennessee River near Paducah, Kentucky (USGS Station ID 03609500). Years with no fluxes shown indicate missing fluxes due to lack of water-quality data or flux estimation model convergence. |
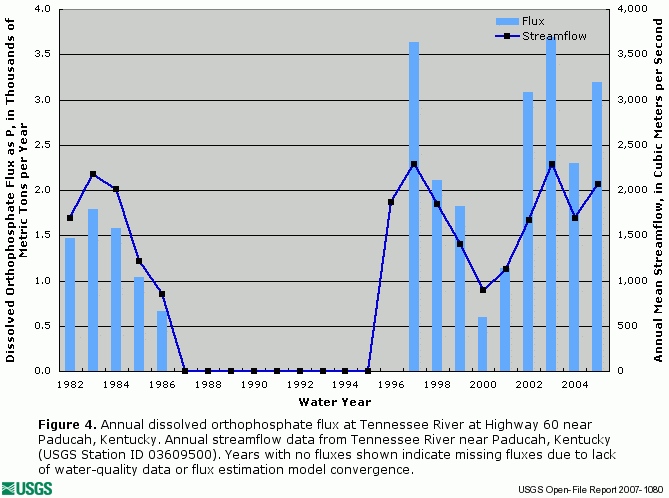 Figure 4. Annual dissolved orthophosphate flux at Tennessee River at Highway 60 near Paducah, Kentucky. Annual streamflow data from Tennessee River near Paducah, Kentucky (USGS Station ID 03609500). Years with no fluxes shown indicate missing fluxes due to lack of water-quality data or flux estimation model convergence. |
|
|
||
| Click on graphs for larger versions. |
The data used to generate the above graphs are available on the following page.
Report Site Map > Graphics of Streamflow and Nutrient Flux > Graphics for Streamflow and Nutrient Flux for Selected Mississippi River Sub-basins with Varied Sizes, Hydrology, Land Use, and Geographic Location > Graphics of Streamflow and Nutrient Flux for the Tennessee River at Highway 60 near Paducah, Kentucky

![]() U.S. Department of the Interior |
U.S. Geological Survey
U.S. Department of the Interior |
U.S. Geological Survey
URL: http://pubsdata.usgs.gov/pubs/of/2007/1080/of-2007-1080/graphics/sub_basins_graphics/TENN-PADU_graphics.html
Page Contact Information: GS Pubs Web Contact
Page Last Modified: Thursday, 06-Mar-2025 19:39:03 EST