Report Site Map > Monitoring Network for Selected Mississippi-Atchafalaya River Subbasins with Varied Sizes, Hydrology, Land Use, and Geographic Location
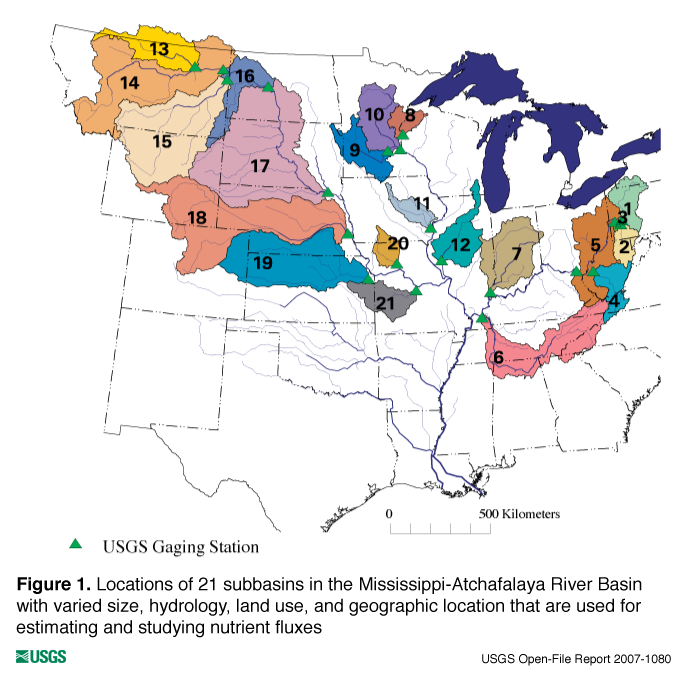
In addition to the stations that are used to estimate delivery to the Gulf of Mexico, and the stations used to estimate nutrient fluxes of major Mississippi River subbasins, monitoring is conducted at stations located within 21 subbasins that vary in size, hydrology, land use, and geographic location. These subbasin drainage areas vary from 16,200 to 630,700 square kilometers. The drainage areas of the 21 subbasins are shown in figure 1, and pertinent station information that defines these subbasins is provided in table 1. Sampling is active for 12 of the 21 selected subbasins as of 2006 as indicated in table 1. Six of the 21 subbasins are currently part of the National Stream Quality Accounting Network (NASQAN) Program network, which is currently designed to collect data for larger subbasins. |
| Station Name | Station ID |
Drainage Area (km2) |
Map # |
Active as of 20061 |
|---|---|---|---|---|
| Allegheny River at New Kensington, Pa.2 | 03049625 | 29,904 | 1 | No |
| Allegheny River at Natrona, Pa. | 03049500 | 29,550 | 1 | NA |
| Monongahela River at Braddock, Pa. | 03085000 | 19,000 | 2 | Yes |
| Ohio River at Sewickley, Pa. | 03086000 | 50,500 | 3 | Yes |
| Kanawha River at Winfield, W. Va.2 | 03201300 | 30,585 | 4 | No |
| Kanawha River at Charleston, W. Va. | 03198000 | 27,060 | 4 | NA |
| Ohio River at Greenup Dam near Greenup, Ky.3 | 03216600 | 161,000 | 5 | Yes |
| Tennessee River at Highway 60 near Paducah, Ky.2 | 03609750 | 104,500 | 6 | Yes |
| Tennessee River near Paducah, Ky. | 03609500 | 104,100 | 6 | Yes |
| Wabash River at New Harmony, Ind.2 | 03378500 | 75,716 | 7 | Yes |
| Wabash River at Mt. Carmel, Ill. | 03377500 | 74,164 | 7 | Yes |
| St. Croix River at St. Croix Falls, Wis. | 05340500 | 16,200 | 8 | No |
| Minnesota River at Jordan, Minn. | 05330000 | 42,000 | 9 | No |
| Mississippi River at Hastings, Minn.2 | 05331580 | 96,100 | 10 | No |
| Mississippi River at St. Paul, Minn. | 05331000 | 95,300 | 10 | NA |
| Iowa River at Wapello, Iowa | 05465500 | 32,400 | 11 | Yes |
| Illinois River at Valley City, Ill. | 05586100 | 69,267 | 12 | Yes |
| Milk River near Nashua, Mont. | 06174500 | 57,840 | 13 | No |
| Missouri River near Culbertson, Mont.4 | 06185500 | 237,130 | 14 | Yes |
| Yellowstone River near Sidney, Mont. | 06329500 | 178,920 | 15 | No |
| Missouri River at Garrison Dam, N. Dak.5 | 06338490 | 469,800 | 16 | Yes |
| Missouri River at Yankton, S. Dak.6 | 06467500 | 630,700 | 17 | No |
| Platte River at Louisville, Nebr. | 06805500 | 221,000 | 18 | Yes |
| Kansas River at DeSoto, Kans. | 06892350 | 154,770 | 19 | No |
| Grand River near Sumner, Mo. | 06902000 | 17,800 | 20 | Yes |
| Osage River below St. Thomas, Mo.7 | 06926510 | 37,772 | 21 | Yes |
| Osage River near St. Thomas, Mo. | 06926500 | 37,550 | 21 | Yes |
| 1 | = | Applies to the collection of water-quality data. |
| 2 | = | Flow measurements are used from nearby stations, which are identified in the next row. |
| 3 | = | Subbasin includes four upstream subbasins (Map numbers 1 through 4). |
| 4 | = | Subbasin includes one upstream subbasin (Map number 13). |
| 5 | = | Subbasin includes three upstream subbasins (Map numbers 13 through 15). |
| 6 | = | Subbasin includes four upstream subbasins (Map numbers 13 through 16). |
| 7 | = | Before 1997, flow measurements are used from nearby station identified in the next row. |
| NA | = | Does not apply to this station. |
Report Site Map > Monitoring Network for Selected Mississippi-Atchafalaya River Subbasins with Varied Sizes, Hydrology, Land Use, and Geographic Location

![]() U.S. Department of the Interior |
U.S. Geological Survey
U.S. Department of the Interior |
U.S. Geological Survey
URL: http://pubsdata.usgs.gov/pubs/of/2007/1080/of-2007-1080/sub_sites_net.html
Page Contact Information: GS Pubs Web Contact
Page Last Modified: Wednesday, 05-Mar-2025 14:48:35 EST