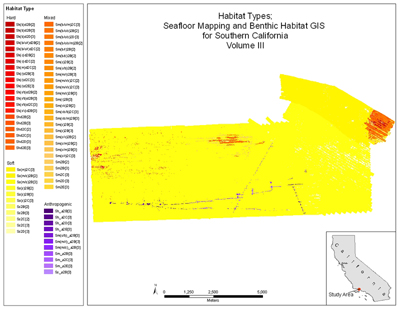

Seafloor Mapping and Benthic Habitat GIS for Southern California, Volume III |
|||||||||||||||||||||||||||||||||||||||||||||||||||||||||||||||||||||||||||||||||||||||||||||||||||||||||||||||||||||||||||||||||||||||||||||||||||||||||||||||||||||||||||||||||||||||||||||||||||||||||||||||||||||||||||||||||||||||||||||||||||||||||||||||||||||||||||||||||||||||||||||||||||||
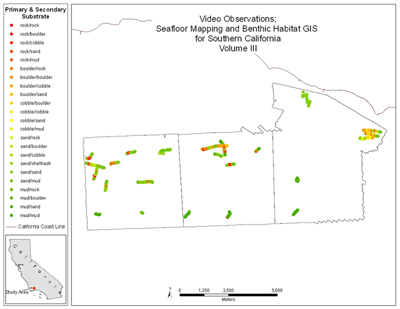
RESULTSSeafloor FeaturesSubstrateClassification of the area mapped by sonar shows that approximately 98% of the seafloor is covered by unconsolidated sandy mud. The sand content increases in the nearshore waters and video observations suggest mud is lacking in waters less than 20m deep. There are hard and mixed areas with bedrock outcrop along the ridge of an east west trending bathymetric high in waters ranging in depth from 35 to 50m. This area is of interest as rockfish habitat in an area near oil platforms that provide artificial habitat. Another rocky area was found off Rincon Point. This rock is an extension of the point into the marine environment and appears to consist of a wide range of angular clasts boulder size and up. Common BiotaAs described in Sea Floor Video methods, the presence of benthic organisms and demersal fish were visually observed and digitally recorded in real time. Twenty-five types of subtidal biota were observed. It is important to note that the towed camera is not adept at observing pelagic species, or demersal species that tend to move upward, move quickly, or move away from a location in response to the camera sleds approach. Of the types of biota that could be successfully recorded, the most common included gorgonians, hydrozoan, sea stars, sea whips, sponges, and white urchins. Gorgonians and sponges were predominantly found in rocky habitats although they were both found in smaller numbers in all other habitat types. Hydrozoans were almost solely seen in mud, cobble, and sand habitat. White urchins were found primarily in sandy habitat. Sea stars were observed in large numbers in all habitat types but this may be due to the fact that we did not distinguish between sea star varieties. The video observation locations and substrate types are shown in Figure 2.
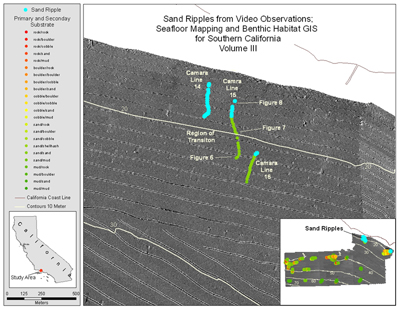
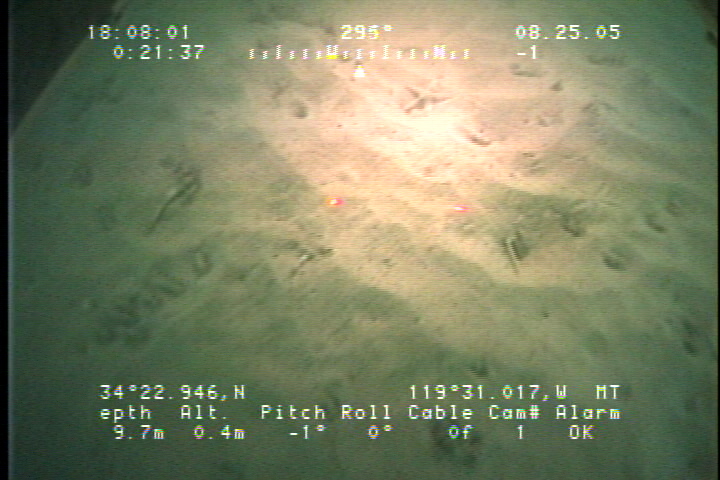
Figure 4. Map of video observations for entire study area. To view a large version of Figure 4 in a new window, click on the image above. Observable in both the bathymetry and backscatter data are isolated spots of high reflectivity, which are generally small (about 5 – 25 square meters), due to dense areas of fish called fish biomass. These anomalies appear as real bottom features. We have reclassified the polygons derived from spots of high backscatter, or fish biomass, based on the surrounding habitat type. We have also added a new modifier to the Deep Water Marine Benthic Habitat Classification Scheme (Greene et al., 1999), “_fb”, to indicate “any mass of fish, squid or aggregating species that reflects sonar.” Video data were collected in the innershelf, north-east section of the study area to determine at what depth the transition from soft, muddy, bioturbated sediment to sand ripples occurs. Figure 5 shows the location of the three lines as well as the points where sand ripples were observed. In the figure, sand ripple observations appear bright blue over the yellow observation point markers. Video observations of these lines confirmed that at 20m there is degradation of ripples by bioturbation. Figure 6 shows a bioturbed view at the deepest point on camara line 15. Figure 7 shows an image in the zone of transition between bioturbated and sand ripples in the center on camara line 15. Figure 8 shows the shallowest point on camara line 15 where the seafloor is predominately sand ripples. For more images of the seafloor along these three video observation lines, please see the hyperlinks in the project available for download included with this OFR (instructions on viewing hyperlinks in ArcGIS9.x).
Figure 5. Location map of sand ripple features in the nearshore region between Carpenteria and Rincon point. Blue dots represent locations where ripples were observed, yellow dots represent locations where ripples were not observed. To view a large version of Figure 5 in a separate window, click on the image above. 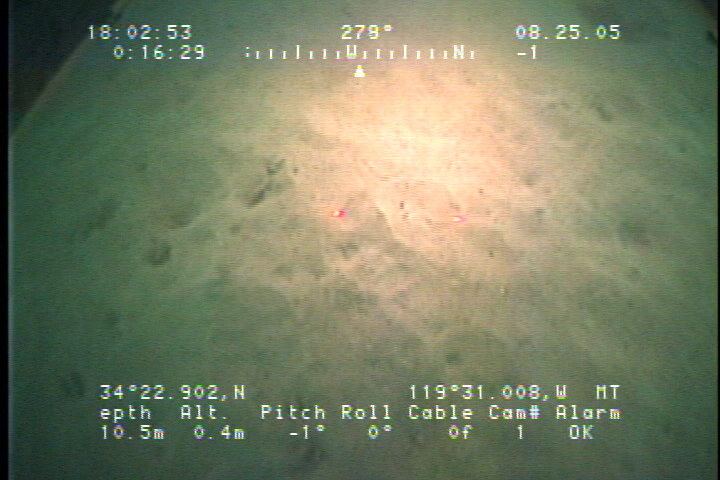
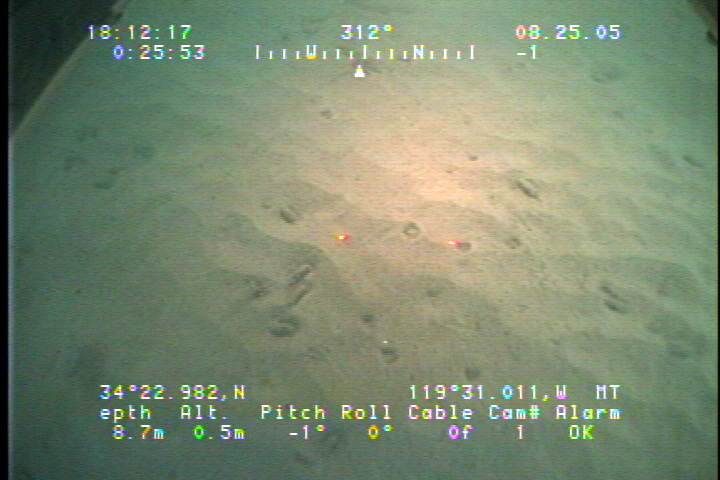
Figure 6. Figure 6 is at the deepest point of camera line 15. Here the ripples are more degraded by bioturbation. > Figure 7. The zone of transition between boturbated and sand ripples in the center of camera line 15.
Figure 8. The shallowest point on camera line 15 where the seafloor is predominately sand ripples. Habitat ClassificationThe 77 sq km study area is located entirely on the continental shelf. Within this area 95% of the seafloor is composed of flat and soft mud or sand. 1.19% of the area is hard bottom; the remainder is a mix of low relief hard bottom and sand or coarser sediment bottom. The hard seafloor is divided into two main rocky regions. One area of rocks is located at the crest of an east-west trending bathymetric ridge in the western and central part of the study area above the 50 m contour and north of the oil platforms. There are 0.373 sq km of exposed bedrock along the ridge of Tertiary age. The only other significant rocky area is a 0.392 sq km area in the east, above the 30m contour line, and directly offshore of Rincon Point. Video over the area shows boulders and larger rocks that are likely a submerged extension of the large delta visible at Rincon Point. Locally, onshore outcrops exist of Sedimentary rocks of Miocene and Pliocene age. Other hard bottom in the survey, 0.132 sq km, is due to anthropogenic features such as oil platforms and pipelines. These man made structures occur in the southern half or the western and central area of the survey below the 50 m contour. Sand ripples were observed in the nearshore region between Carpentaria and Rincon Point. As depth increases offshore there is an increase in the number of burrowing and bioturbation which decreases the continuity of the bedforms (see figures 6 - 8). We assume that the bedforms suggest stronger bottom currents, and based on the video we have separated the nearshore rippled zone from the more bioturbated zone by dividing polygons using the 20 m depth contour. Figure 9 illustrates the distribution of benthic habitat types. Table 1 provides a translation of the benthic habitat codes used in this study. Details of the classification methodology can be found in Greene et al. (1999). Habitat Classification Map
Figure 9. Map showing the habitat types for the study area. To view a large version of Figure 9 in a separate window, click on the image above. Habitat Classification Table
Table 1. Column one is the Greene et al (1999) Habitat Code. Column two is the definition of the habitat code. Column three is the total area of the habitat type in square meters. Column four is the percent total of the habitat type for the total study area. |
Project Description
|
||||||||||||||||||||||||||||||||||||||||||||||||||||||||||||||||||||||||||||||||||||||||||||||||||||||||||||||||||||||||||||||||||||||||||||||||||||||||||||||||||||||||||||||||||||||||||||||||||||||||||||||||||||||||||||||||||||||||||||||||||||||||||||||||||||||||||||||||||||||||||||||||||||
|
|||||||||||||||||||||||||||||||||||||||||||||||||||||||||||||||||||||||||||||||||||||||||||||||||||||||||||||||||||||||||||||||||||||||||||||||||||||||||||||||||||||||||||||||||||||||||||||||||||||||||||||||||||||||||||||||||||||||||||||||||||||||||||||||||||||||||||||||||||||||||||||||||||||
Accessibility | FOIA | Privacy | Policies and Notices
U.S. Department of the Interior U.S. Geological Survey
URL: https://pubs.usgs.gov/of/2007/1271/results.html
maintained by Michael Diggles
last modified October 12, 2010 (mfd)