U.S. Geological Survey Open-File Report 2008-1206
Coastal Change Along the Shore of Northeastern South Carolina: The South Carolina Coastal Erosion Study
Return to: Title and Abstract » Table of Contents » Section 1 » Section 2 » Section 3 » Section 4 » Section 5 » Section 6 » Acknowledgments » References » List of Figures » Acronymns » Glossary |
Box #1: Sea-Level ChangeGraphs A-C illustrate sea-level changes that occur over different time and spatial scales. Images D-F display the impacts of sea-level changes on coastal areas that range from local flooding due to storm surges to long-term migration of shorelines across the region due to climate-driven increases in sea level. |
|||||||||||||
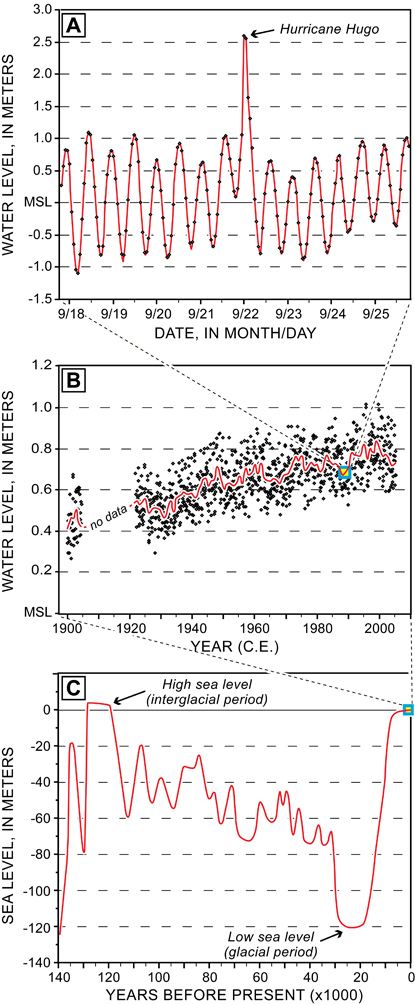 |
A. EVENT SCALE (hours to days) The tide gauge at Charleston Harbor shows variations in water levels due to tides, and an anomalously high tide when Hurricane Hugo made landfall at midnight on September 21, 1989. The storm surge rose 2.6 m (8.0 ft) above mean sea level (MSL) at Charleston and over 6 m (20 ft) above MSL in coastal areas 20 miles to the north (Brennan, 2001). Data from NOAA National Ocean Service (http://tidesonline.nos.noaa.gov/)
B. HISTORICAL SCALE (decades to centuries) Tide-gauge records depict fluctuations in the elevation of mean high water (MHW) from 1900 to 2005. Monthly averages (black dots) are overlain with a curve showing the annual average (red line). The long-term trend in sea-level rise is about 3.3 mm/year (1.1 ft/century). Data from NOAA National Ocean Service (http://tidesonline.nos.noaa.gov/)
C. GEOLOGICAL SCALE (thousands of years) Large changes in global sea level have occurred due to glacial cycles and changes in continent-based ice volumes. Geologic evidence shows that about 120,000 years ago sea level was at or above its present elevation. Barrier islands existed along the South Carolina coast, much like today. Sea level later fell as glaciers grew during the last Ice Age and, about 21,000 years ago, the shoreline was far out on the continental shelf. Since that time, climate warming and melting glaciers have driven the ongoing rise in sea level and general landward migration of the shoreline to its present position. Figure modified from Lambeck and Chappell (2001, Figure 1B). |
||||||||||||
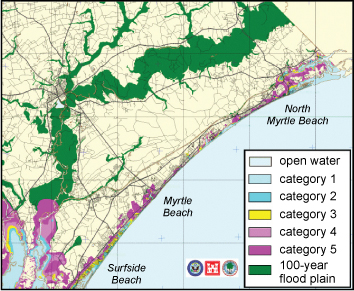 |
D. STORM SURGE (hours to days) The image shows areas of the Grand Strand at risk of inundation from hurricanes. Differences in the height of surge from a given storm result from a site's proximity to landfall, geometry of the coastline, and the depth of water offshore. Barrier islands in the northeastern and southwestern parts of the map (pink tones) are at highest risk from category 4-5 hurricanes. Mainland-attached beaches in the center near Myrtle Beach maintain relatively high elevations that provide a greater degree of protection. The image was developed by the U.S. Army Corps of Engineers using the Sea Lake and Overland Surges from Hurricanes (SLOSH) model, which was developed by the Federal Emergency Management Agency (FEMA), United States Army Corps of Engineers (USACE), and the National Weather Service (NWS). |
||||||||||||
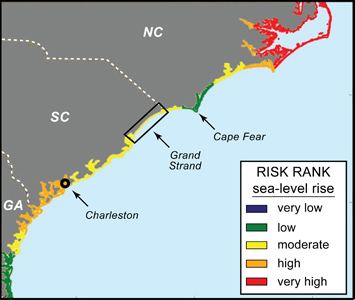 |
E. SEA-LEVEL RISE (decades to centuries) Image showing the risk from sea-level rise along the North Carolina to Georgia coast. The risk is lowest in the vicinity of Cape Fear due to the relatively high slope of the upland adjacent to the coast. Modified from Thieler and Hammar-Klose (1999, Figure 10).
|
||||||||||||
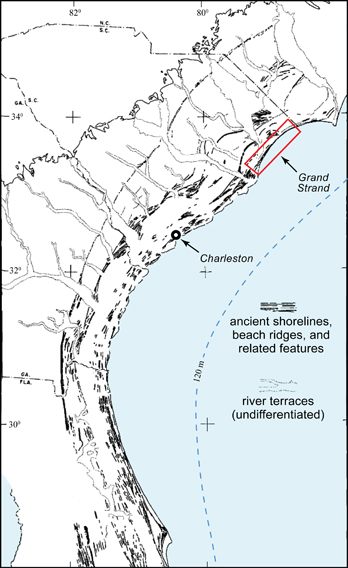 |
F. SEA-LEVEL CHANGE (thousands of years) Image of the southeastern United States showing a series of ancient shorelines that formed at previous highstands of sea level. The shoreline deposits are preserved on the middle to lower coastal plain. The 120-m depth contour (dashed blue line) shows the approximate position of the shoreline during the last Ice Age when sea level was lowest relative to today. Little evidence of shorelines marking lower sea levels exists due to reworking of the continental shelf by terrestrial and marine processes. Figure modified from Winker and Howard (1977, Figure 1) |
||||||||||||

 U.S. Department of the Interior |
U.S. Geological Survey
U.S. Department of the Interior |
U.S. Geological Survey
[an error occurred while processing this directive]
URL: https://pubsdata.usgs.gov
Page Contact Information: Publishing Service Center
Page Last Modified: Wednesday, 07-Dec-2016 21:39:12 EST
