BATHY_2M: Bathymetric data collected by the U.S. Geological Survey off the southern shore of Martha's Vineyard, MA, 2007 (ESRI BINARY GRID)

Metadata also available as - [Outline] - [Parseable text]

Frequently-anticipated questions:


What does this data set describe?

Title:
BATHY_2M: Bathymetric data collected by the U.S. Geological Survey off the southern shore of Martha's Vineyard, MA, 2007 (ESRI BINARY GRID)
Abstract:
The USGS Woods Hole Science Center conducted a nearshore geophysical survey offshore of the southern coast of Martha's Vineyard, in the vicinity of the Martha's Vineyard Coastal Observatory (MVCO) in August 2007. This mapping program was part of a larger research effort supporting the Office of Naval Research (ONR) Ripples Directed-Research Initiative (DRI) studies at MVCO by providing data collection and modeling. The geophysical data will be used to provide initial conditions for wave and circulation models for the study area. Ultimately, geophysical mapping, oceanographic measurements and modeling will help to improve our understanding of coastal sediment-transport processes.

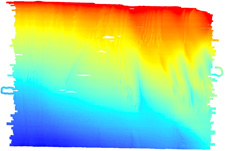
The geophysical mapping utilized a suite of high-resolution instrumentation to map the surficial sediment distribution, depth and sub-surface geology: dual-frequency 100/500 KHz sidescan-sonar system, 234-KHz interferometric sonar, and 500 Hz -12 KHz chirp sub-bottom profiler. The survey was conducted aboard the M/V Megan Miller August 9-13, 2007. The study area covers 35 square kilometers from about 0.2 km to 5-km offshore of the south shore of Martha's Vineyard, and ranges in depth from ~ 5 to 20 meters.

  1. How should this data set be cited?

    U.S. Geological Survey, 2009, BATHY_2M: Bathymetric data collected by the U.S. Geological Survey off the southern shore of Martha's Vineyard, MA, 2007 (ESRI BINARY GRID): Open-File Report 2008-1288, U.S. Geological Survey, Woods Hole.

    Online Links:

    This is part of the following larger work.

    Denny, J.F., Danforth, W.W., Foster, D.S., and Sherwood, C.R., 2009, Geophysical Data Collected off the South Shore of Martha's Vineyard, Massachusetts: Open-File Report 2008-1288, U.S. Geological Survey, Woods Hole.

    Online Links:

  2. What geographic area does the data set cover?

    West_Bounding_Coordinate: -70.601447
    East_Bounding_Coordinate: -70.510810
    North_Bounding_Coordinate: 41.349941
    South_Bounding_Coordinate: 41.300598

  3. What does it look like?

    <https://pubs.usgs.gov/of/2008/1288/GIS_catalog/Bathy/bathy_2m_sm.jpg> (JPEG)
    Thumbnail image of the bathymetric data collected by the U.S. Geological Survey off the southern shore of Martha's Vineyard, 2007

  4. Does the data set describe conditions during a particular time period?

    Beginning_Date: 09-Aug-2007
    Ending_Date: 13-Aug-2007
    Currentness_Reference: ground condition

  5. What is the general form of this data set?

    Geospatial_Data_Presentation_Form: raster digital data

  6. How does the data set represent geographic features?

    1. How are geographic features stored in the data set?

      This is a Raster data set. It contains the following raster data types:

      • Dimensions 2672 x 3745 x 1, type Grid Cell

    2. What coordinate system is used to represent geographic features?

      Grid_Coordinate_System_Name: Universal Transverse Mercator
      Universal_Transverse_Mercator:
      UTM_Zone_Number: 19
      Transverse_Mercator:
      Scale_Factor_at_Central_Meridian: 0.999600
      Longitude_of_Central_Meridian: -69.000000
      Latitude_of_Projection_Origin: 0.000000
      False_Easting: 500000.000000
      False_Northing: 0.000000

      Planar coordinates are encoded using row and column
      Abscissae (x-coordinates) are specified to the nearest 2.000534
      Ordinates (y-coordinates) are specified to the nearest 2.000534
      Planar coordinates are specified in meters

      The horizontal datum used is D_WGS_1984.
      The ellipsoid used is WGS_1984.
      The semi-major axis of the ellipsoid used is 6378137.000000.
      The flattening of the ellipsoid used is 1/298.257224.

      Vertical_Coordinate_System_Definition:
      Depth_System_Definition:
      Depth_Datum_Name:
      local vertical datum (Martha's Vineyard Coastal Observatory (MVCO) (htto://www.whoi.edu/mvco/description/description2.html)
      Depth_Resolution: 0.5
      Depth_Distance_Units: meters
      Depth_Encoding_Method: Explicit depth coordinate included with horizontal coordinates

  7. How does the data set describe geographic features?


Who produced the data set?

  1. Who are the originators of the data set? (may include formal authors, digital compilers, and editors)

  2. Who also contributed to the data set?

    U.S. Geological Survey

  3. To whom should users address questions about the data?

    Jane Denny
    U.S. Geological Survey
    Geologist
    384 Woods Hole Rd.
    Woods Hole, MA 02543-1598

    (508) 548-8700x2311 (voice)
    5084572310 (FAX)
    jdenny@usgs.gov


Why was the data set created?

This bathymetric data set will be used to define the seafloor morphology in the vicinity of the Martha's Vineyard Coastal Observatory and to provide initial conditions for wave and circulation modeling.


How was the data set created?

  1. From what previous works were the data drawn?

    (source 1 of 1)
    .

    Source_Contribution:
    Swath bathymetric data were collected using an SEA Ltd SWATHplus 234-kHz Interferometric Bathymetric Sonar (<http://www.sea.co.uk/swathplus.aspx?nav=products> ) during survey operations. The SWATHplus system was mounted as a sidemount and positioned on the starboard side of the R/V Megan Miller. Line spacing varied from 40 meter in ~ 5 to 15 meter water depth to 70 meters in ~15 - 25 meter water depth.

    Data files were recorded by SEA software SWATHplus 3.05.19 in the SWATHplus SXR format. Data collection parameters are saved into a SWATHplus session file in SEA's SXS format that can be later used for data replay.

    Pitch, roll, heading, and heave information were recorded using a Coda Octopus F180R motion reference unit (MRU) (see: <http://www.codaoctopus.com/motion/f180/index.asp>) and transmitted via network connection to the SWATHplus data collection software. The MRU sensor was mounted directly above the SWATHplus transducers, thereby minimizing "lever arm" offsets which can lead to positioning and depth errors in the bathymetric data. The F180R series MRU uses two L1 antennas for position and heading accuracy. These were mounted directly above the MRU with an offset of 6.76 meters. The antennas are mounted on a rigid horizontal pole with a separation of 1 meter and are offset from the MRU in a forward/aft configuration. The forward offset of the primary antenna from the MRU is 0.5 meters, with no port/starboard offset.

    Sound Velocity Profiles (SVP): Fourteen sound velocity casts were collected at various intervals during the USGS cruise 07011 using an Applied Microsystems SV Plus v2 instrument (see <http://www.appliedmicrosystems.com/products/productDetails.aspx?id=1> for details). Sound velocity profiles (SVP) were generally collected at the eastern and western ends of the survey area, corresponding to the start and/or end of geophysical line data collection. This procedure was primarily followed to coordinate collection of SVP casts with the beginning or end of trackline. This was acceptable because only small variations in the speed of sound were noted throughout the survey area and negligible refraction artifacts were visible within the swath bathymetric data.

  2. How were the data generated, processed, and modified?

    Date: 2008 (process 1 of 14)
    Offsets of the SWATHplus transducers and DGPS navigation antenna from the F180R motion reference unit (MRU), which is the designated common reference point (CRP), were verified as entered correctly into the SWATHplus session file for the survey. Offsets forward, below, and to the right (starboard) of the CRP are considered positive:

    Primary navigation antenna to MRU: Height offset: -6.76 meters Forward offset: 0 meters Starboard offset: 0 meters

    Draft of the MRU below water line: 2.6 meters.

    Offset of SWATHplus transducer 1 (port side) from the CRP: Height offset: 0.158 meters Forward offset: -0.019 meters Starboard offset: -0.11 meters

    Offset of SWATHplus transducer 2 (starboard side) from the CRP: Height offset: 0.158 meters Forward offset: -0.019 meters Starboard offset: 0.11 meters

    Software: SWATHplus 3.05.19

    Person who carried out this activity:

    Bill Danforth
    U.S. Geological Survey
    Geologist
    384 Woods Hole Rd.
    Woods Hole, MA 02543-1598
    USA

    (508) 548-8700x2274 (voice)
    5084572310 (FAX)
    bdanforth@usgs.gov

    Date: 2008 (process 2 of 14)
    Water level heights for the duration of the survey were incorporated into the SWATHplus session file. The Woods Hole Oceanographic Institution Martha's Vineyard Coastal Observatory (MVCO) maintains an instrumented node at a depth of 12 meters that records a variety of oceanographic data including water level heights above the node (<http://www.whoi.edu/mvco/description/description2.html>). Oscillation of the water level above the node is recorded in a file that was downloaded and parsed for these heights (OcnDat_s, see: <http://www.whoi.edu/mvco/data/oceandata.html>). These heights are referenced to a vertical datum of 11.68 meters, which represents a long term mean depth directly above the node (August 2006 - present). These data are not tied into any chart datum (i.e. Mean Lower Low Water). The data were reformatted for input into the SWATHplus session file and stored in the file 2007_JD221-225_tides_swathplus.dat. We chose to use these water level heights because other oceanographic data from the 12 meter node will be used in conjunction with the bathymetric grid for oceanographic modeling.

    Software: SWATHplus 3.05.19

    Person who carried out this activity:

    Bill Danforth
    U.S. Geological Survey
    Geologist
    384 Woods Hole Rd.
    Woods Hole, MA 02543-1598
    USA

    (508) 548-8700x2274 (voice)
    5084572310 (FAX)
    bdanforth@usgs.gov

    Date: 2008 (process 3 of 14)
    Data from the sound velocity profiles were incorporated into the SWATHplus session file. The velocity data is stored in Microsoft Office Excel 2003 SP3 csv format, and the location and time, as well as the velocity information, were extracted from the csv file and entered into the sound velocity profile dialog in SWATHplus. One Julian day's worth of sound velocity data was entered into SWATHplus; the program is limited to a total of 5 velocity profiles at a time.

    Software: SWATHplus 3.05.19

    Person who carried out this activity:

    Bill Danforth
    U.S. Geological Survey
    Geologist
    384 Woods Hole Rd.
    Woods Hole, MA 02543-1598
    USA

    (508) 548-8700x2274 (voice)
    5084572310 (FAX)
    bdanforth@usgs.gov

    Date: 2008 (process 4 of 14)
    Various filters were set in the SWATHplus software in order to refine the depth of the seafloor across the swath for each ping based on the phase and amplitude of the returning sonar signal. Only the filters listed below were set, all others were turned off. Filter settings:

    Low amp: 100 Range: Max amplitude 4 meters, min amplitude 0 meters Quality: 0.8 Box: Min depth 3 meters, max depth 30 meters, min horizontal range 0 meters, max horizontal range 25 - 50 meters (increasing with trackline spacing). Along track 1: Max depth difference 10 meters, window size 10, learn rate 0.6 Along track 2: Max depth difference 0.5 meters, window size 2, learn rate 0.8 Mean output processed pixel size: 1meter.

    Software: SWATHplus 3.05.19

    Person who carried out this activity:

    Bill Danforth
    U.S. Geological Survey
    Geologist
    384 Woods Hole Rd.
    Woods Hole, MA 02543-1598
    USA

    (508) 548-8700x2274 (voice)
    5084572310 (FAX)
    bdanforth@usgs.gov

    Date: 2008 (process 5 of 14)
    Patch test lines were replayed through the SWATHplus software after the tides, velocity profiles (for that day), and filters were set and saved in the SWATHplus session file. Processed data files were saved in the SWATHplus sxp format.

    Software: SWATHplus 3.05.19

    Person who carried out this activity:

    Bill Danforth
    U.S. Geological Survey
    Geologist
    384 Woods Hole Rd.
    Woods Hole, MA 02543-1598
    USA

    (508) 548-8700x2274 (voice)
    5084572310 (FAX)
    bdanforth@usgs.gov

    Date: 2008 (process 6 of 14)
    The patch test processed sxp files (patch1 - patch7.sxp) were imported into the SWATHplus Grid Processor program and run 3 times through the calibration tool to determine any static offsets for roll. Results: Port roll offset = +0.64 degrees, Stbd roll offset = -0.91 degrees. These offsets were then entered into the SWATHplus session file.

    Software: Grid Processor 3.02.19

    Person who carried out this activity:

    Bill Danforth
    U.S. Geological Survey
    Geologist
    384 Woods Hole Rd.
    Woods Hole, MA 02543-1598
    USA

    (508) 548-8700x2274 (voice)
    5084572310 (FAX)
    bdanforth@usgs.gov

    Date: 2008 (process 7 of 14)
    Raw SXR bathymetry data were replayed line by line through the SEA SWATHplus software to produce final processed SWATHplus sxp files. Velocity profiles were incorporated into the session file five at a time bracketing (in time) the bathymetric data collected for that line. This ensures that during the time the bathymetry data were collected, sound velocity information closest in time were utilized by the SWATHplus program to correct for variations in sound velocity through the water column, minimizing ray bending effects that can produce erroneous depth soundings. The SWATHplus software applies the pitch, roll, heave, and heading data supplied by the F180R MRU, ensuring that the depth solutions across the swath are compensated for any motion of the SWATHplus transducers due to ship motion.

    Software: SWATHplus 3.05.19

    Person who carried out this activity:

    Bill Danforth
    U.S. Geological Survey
    Geologist
    384 Woods Hole Rd.
    Woods Hole, MA 02543-1598
    USA

    (508) 548-8700x2274 (voice)
    5084572310 (FAX)
    bdanforth@usgs.gov

    Date: 2008 (process 8 of 14)
    All the processed SWATHplus sxp files were imported into CARIS HIPS/SIPS software (www.caris.com) using the CARIS HIPS Conversion Wizard. The selected raw data type was SWATHplus. The conversion wizard converts the depths, navigation, and motion data recorded in the sxp files into an internal CARIS HIPS format.

    Software: CARIS HIPS/SIPS 6.1

    Person who carried out this activity:

    Bill Danforth
    U.S. Geological Survey
    Geologist
    384 Woods Hole Rd.
    Woods Hole, MA 02543-1598
    USA

    (508) 548-8700x2274 (voice)
    5084572310 (FAX)
    bdanforth@usgs.gov

    Date: 2008 (process 9 of 14)
    Using the SWATHplus sxp survey lines that were imported into CARIS, a field sheet and BASE surface were generated in CARIS HIPS that encompassed the field area. The field sheet is in the UTM projection, 19N, central meridian -69.0 degrees west. The horizontal datum was chosen to be the WGS 84 ellipsoid. The extent of the field sheet is (in UTM meters):

    East: 366027 West: 373547 North: 4578733 South: 4573363

    Software: CARIS HIPS/SIPS 6.1

    Person who carried out this activity:

    Bill Danforth
    U.S. Geological Survey
    Geologist
    384 Woods Hole Rd.
    Woods Hole, MA 02543-1598
    USA

    (508) 548-8700x2274 (voice)
    5084572310 (FAX)
    bdanforth@usgs.gov

    Date: 2008 (process 10 of 14)
    A Bathymetry Associated with Statistical Error (BASE) Surface was generated from the survey line data using the bounds from the field sheet properties. A BASE surface is a georeferenced image of a multi-attributed, weighted-mean surface. A BASE Surface can also contain a visual representation of horizontal and vertical uncertainty. A BASE Surface file is saved with a HNS extension (HIPS Navigation Surface). An XML file with the same name as the BASE Surface is also generated when the Surface is created. This file contains the metadata for the Surface. Base surfaces were generated at a resolution of 10, 5, and 2 meters, and the surface type was set to swath angle. The maximum footprint size in the BASE surface that a sounding was utilized was set to 9 pixels, and the include status for soundings were set to accepted, examined, and outstanding. Additional attributes were set for the surface: Density, mean, and standard deviation.

    Software: CARIS HIPS/SIPS 6.1

    Person who carried out this activity:

    Bill Danforth
    U.S. Geological Survey
    Geologist
    384 Woods Hole Rd.
    Woods Hole, MA 02543-1598
    USA

    (508) 548-8700x2274 (voice)
    5084572310 (FAX)
    bdanforth@usgs.gov

    Date: 2008 (process 11 of 14)
    Each of the BASE surfaces was interpolated in CARIS HIPS. The interpolation is only applied to areas of no data, and helped to fill in small gaps in the surface. Parameters used for the interpolation were: Matrix size 5X5 pixels, minimum number of neighboring pixels required for interpolation was 6.

    Software: CARIS HIPS/SIPS 6.1

    Person who carried out this activity:

    Bill Danforth
    U.S. Geological Survey
    Geologist
    384 Woods Hole Rd.
    Woods Hole, MA 02543-1598
    USA

    (508) 548-8700x2274 (voice)
    5084572310 (FAX)
    bdanforth@usgs.gov

    Date: 2008 (process 12 of 14)
    The final interpolated base surfaces generated in CARIS HIPS was imported into IVS3D's Data Magician (DMagic), a program that is part of the IVS3D Fledermaus suite (www.ivs3d.com). The data magician directly imports the CARIS HNS file described above, and creates a DTM (digital terrain model) and associated geo file for each surface.

    Software: IVS DMagic 6.7.0

    Person who carried out this activity:

    Bill Danforth
    U.S. Geological Survey
    Geologist
    384 Woods Hole Rd.
    Woods Hole, MA 02543-1598
    USA

    (508) 548-8700x2274 (voice)
    5084572310 (FAX)
    bdanforth@usgs.gov

    Date: 2008 (process 13 of 14)
    The DTM surfaces created in the Fledermaus Data Magician (DMagic) were converted to a Fledermaus sd file that can be used in the Fledermaus program for three dimensional visualization of the DTM.

    Only the highest resolution DTM surface ( 2-m resolution ) was exported from IVS Data Magician as an ArcView Grid (ESRI ASCII grid) .

    Software: IVS DMagic 6.7.0

    Person who carried out this activity:

    Bill Danforth
    U.S. Geological Survey
    Geologist
    384 Woods Hole Rd.
    Woods Hole, MA 02543-1598
    USA

    (508) 548-8700x2274 (voice)
    5084572310 (FAX)
    bdanforth@usgs.gov

    Date: 2009 (process 14 of 14)
    The ESRI ASCII grids were then imported to ArcGIS 9.2 using the ASCII to Raster Tool within ArcToolbox - Conversion Tools - To Raster and output data type defined as float.

    The projection of the grids was then defined as UTM, zone 19N, WGS84, using Arc Toolbox, Data Management Tools, Projections and Transformations, Define Projection.

    Software: ESRI ArcGIS 9.2

    Person who carried out this activity:

    Jane Denny
    U.S. Geological Survey
    Geologist
    384 Woods Hole Rd.
    Woods Hole, MA 02543-1598
    USA

    (508) 548-8700x2311 (voice)
    5084572310 (FAX)
    jdenny@usgs.gov

  3. What similar or related data should the user be aware of?


How reliable are the data; what problems remain in the data set?

  1. How well have the observations been checked?

  2. How accurate are the geographic locations?

    Differential Global Positioning System (DGPS) navigation data were acquired with the forward, or primary, Coda Octopus F180R Motion Reference Unit (MRU) DGPS antenna and transmitted via a network connection to the SWATHplus data collection software. The F180R MRU is part of the rigid sidemount used to deploy the SWATHplus bathymetric system, and is mounted on the bracket holding the SWATHplus transducers. The F180R MRU consists of 2 L1 antennas used for position and heading. The antennas are mounted on a rigid horizontal pole, 6.76 meters above the F180R MRU, offset in a forward/aft configuration (see 'source contribution' for a full description of the F180R). DGPS accuracy is 1 to 3 meters, depending on the distance from a US Coast Guard coastal repeater station (<http://www.navcen.uscg.gov/>).

  3. How accurate are the heights or depths?

    Bathymetric data were ultimately referenced to a local vertical datum. The Woods Hole Oceanographic Institution Martha's Vineyard Coastal Observatory (MVCO) maintains an instrumented node at a depth of 12 meters that records a variety of oceanographic data including water level heights above the node (<http://www.whoi.edu/mvco/description/description2.html>). Oscillation of the water level above the node is recorded in a file that was downloaded and parsed for these heights (OcnDat_s, see: <http://www.whoi.edu/mvco/data/oceandata.html>). These heights are referenced to a vertical datum of 11.68 meters, which represents a long term mean depth directly above the node (August 2006 - present). These data are not tied into any chart datum (i.e. Mean Lower Low Water). We chose to use the local water level heights because other oceanographic data from the 12-meter node will be used in conjunction with the bathymetric grid for oceanographic modeling. All data will be referenced to the local vertical datum at the 12-meter node.

  4. Where are the gaps in the data? What is missing?

    All bathymetric data collected during USGS cruise 07011 off of the south shore of Martha's Vineyard were used to generate the bathymetric grid. Tie lines that fell close to areas of obstruction (e.g. MVCO 12-m node and tower), were not included in the final grid due to poor data quality.

  5. How consistent are the relationships among the observations, including topology?

    All bathymetric data were collected during USGS cruise 07011 using a SWATHplus swath bathymetric system and a Coda Octopus F180R motion reference unit. Quality control was conducted during processing of the data. Any spurious data or artifacts were removed or minimized.


How can someone get a copy of the data set?

Are there legal restrictions on access or use of the data?

Access_Constraints: None
Use_Constraints:
These data are not to be used for navigation. Public domain data from the U.S. Government are freely redistributable with proper metadata and source attribution. Please recognize the U.S. Geological Survey as the originator of the dataset.

  1. Who distributes the data set? (Distributor 1 of 1)

    Jane Denny
    U.S. Geological Survey
    Geologist
    384 Woods Hole Rd.
    Woods Hole, MA 02543-1598

    (508) 548-8700x2311 (voice)
    5084572310 (FAX)
    jdenny@usgs.gov

  2. What's the catalog number I need to order this data set?

    Downloadable Data

  3. What legal disclaimers am I supposed to read?

    Neither the U.S. Government, the Department of the Interior, nor the USGS, nor any of their employees, contractors, or subcontractors, make any warranty, express or implied, nor assume any legal liability or responsibility for the accuracy, completeness, or usefulness of any information, apparatus, product, or process disclosed, nor represent that its use would not infringe on privately owned rights. The act of distribution shall not constitute any such warranty, and no responsibility is assumed by the USGS in the use of these data or related materials.

    Any use of trade, product, or firm names is for descriptive purposes only and does not imply endorsement by the U.S. Government.

  4. How can I download or order the data?

  5. What hardware or software do I need in order to use the data set?

    The grid contained in the GIS_catalog.zip file is available as an ESRI binary grid. To utilize this data, the user must have a GIS software package capable of reading an ESRI binary grid. The grid contained in the bathy_2m.zip file is available as an ASCII grid with an ESRI header. To utilize these data, the user must have a GIS software package capable of reading ASCII grids with ESRI headers, or be able to manipulate an ASCII matrix with a geospatial header. The ASCII raster files can be easily converted to ESRI grid format in either ArcView with Spatial Analyst extension (Import Data Source: ASCII Raster) or ArcGIS with Spatial Analyst extension (ASCII to Raster). The user should select floating point grid (as opposed to integer grid) when converting the bathymetry data.


Who wrote the metadata?

Dates:
Last modified: 04-Oct-2009
Metadata author:
Jane Denny
U.S. Geological Survey
Geologist
384 Woods Hole Rd.
Woods Hole, MA 02543-1598

(508) 548-8700x2311 (voice)
5084572310 (FAX)
jdenny@usgs.gov

Metadata standard:
FGDC Content Standards for Digital Geospatial Metadata (FGDC-STD-001-1998)
Metadata extensions used:


Generated by mp version 2.8.25 on Sun Oct 04 13:02:25 2009