Skip past header information
USGS - science for a changing world
CZM logo with link to CZM home page

U.S. Geological Survey Open-File Report 2010-1006

Geophysical and Sampling Data from the Inner Continental Shelf: Northern Cape Cod Bay, Massachusetts


Skip past contents information Title Page / Contents / List of Figures / Conversion Factors / Abstract / Introduction / Data Collection/Processing / Acknowledgments / References Cited / Appendix 1 / Appendix 2 / Appendix 3


Figure 6, map showing backscatter intensity and sample locations.


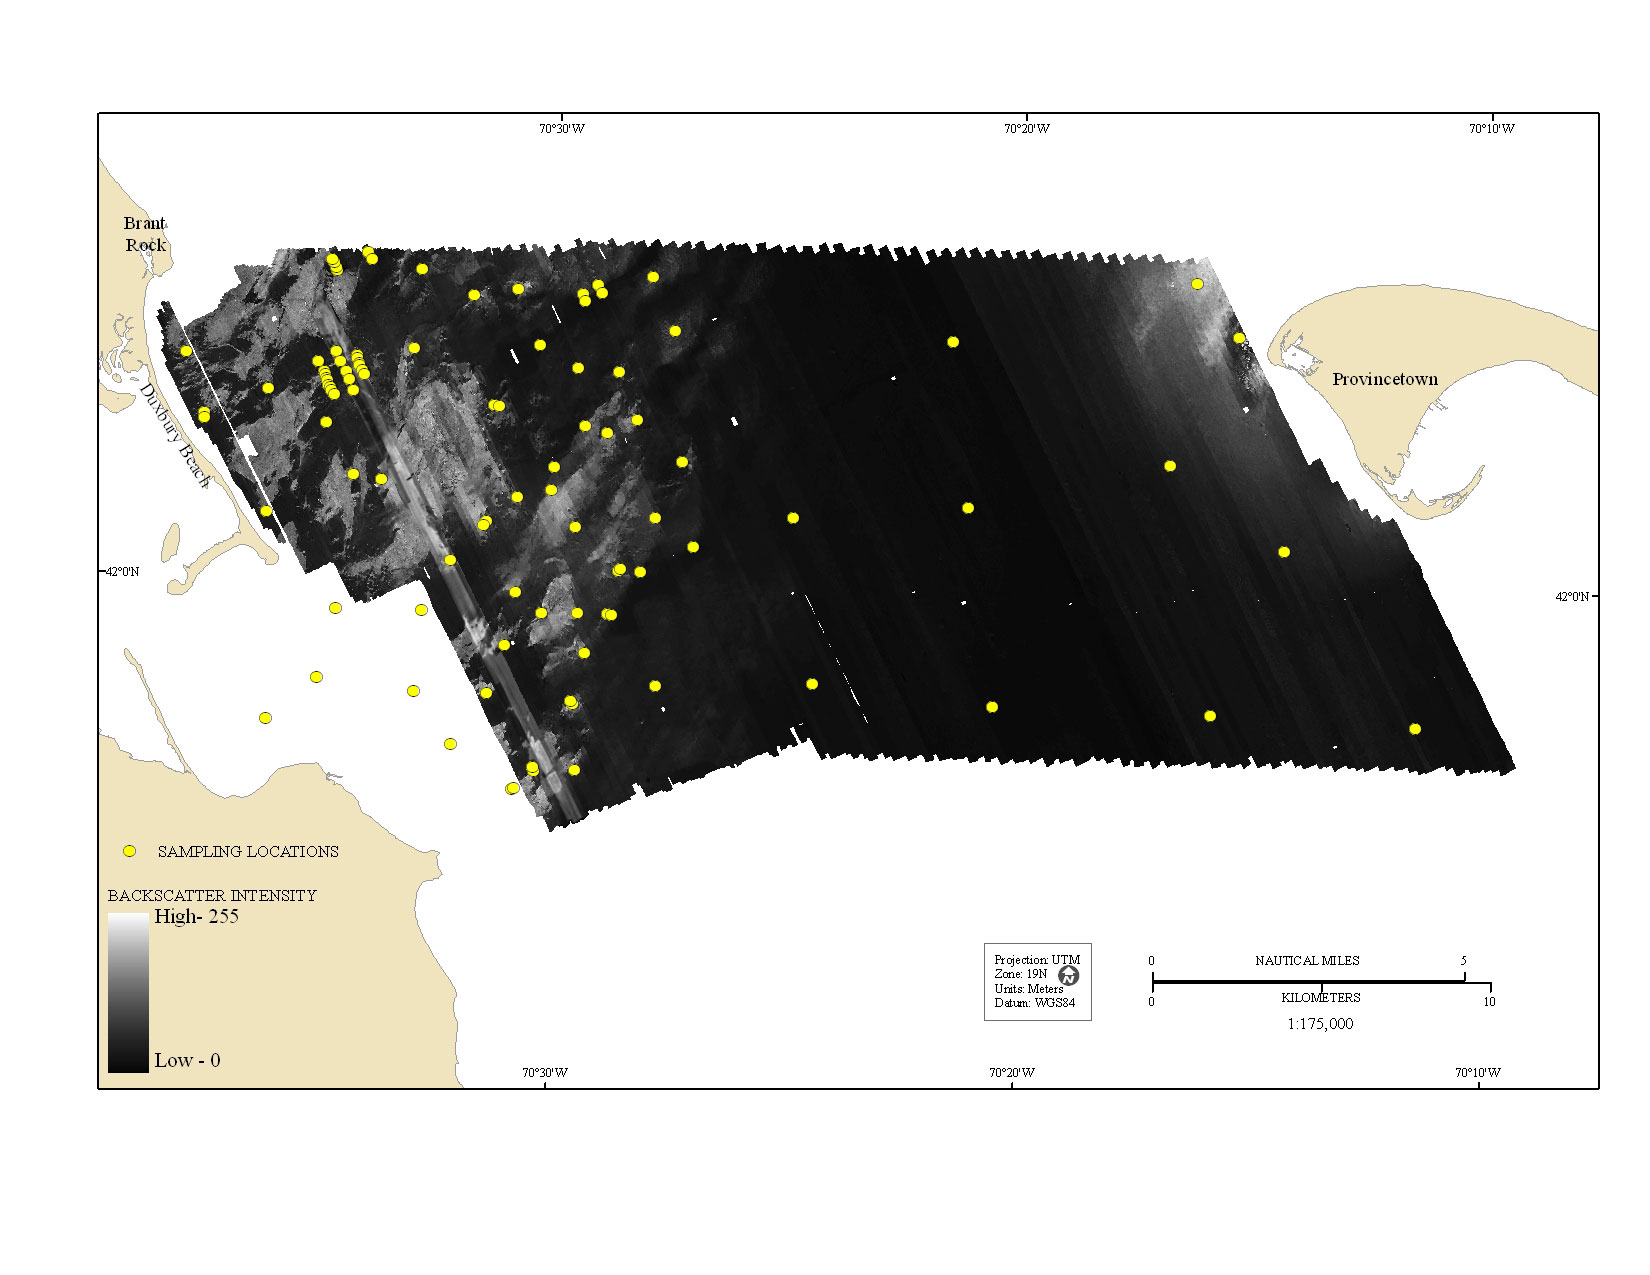
Figure 6.  Map showing acoustic-backscatter intensity of the seafloor in the northern Cape Cod Bay survey area. Backscatter intensity is an acoustic measure of the hardness and roughness of the seafloor. In general, higher values (light tones) represent rock, boulders, cobbles, gravel, and coarse sand. Lower values (dark tones) generally represent fine sand and muddy sediment. Locations of sediment samples are identified as yellow circles.

Skip USGS links group

Accessibility FOIA Privacy Policies and Notices

Take Pride in America logo USAGov logo U.S. Department of the Interior | U.S. Geological Survey
End of USGS links group