IRB_BATHY_GEO.TIFF: Depth-colored GeoTIFF image of the bathymetry of Indian River Bay, Delaware, generated from fathometer data acquired in April 2010 during U.S. Geological Survey Field Activity 2010-006-FA (Geographic, WGS 84)

Metadata also available as - [Outline] - [Parseable text] - [XML]

Frequently-anticipated questions:


What does this data set describe?

Title:
IRB_BATHY_GEO.TIFF: Depth-colored GeoTIFF image of the bathymetry of Indian River Bay, Delaware, generated from fathometer data acquired in April 2010 during U.S. Geological Survey Field Activity 2010-006-FA (Geographic, WGS 84)
Abstract:
A geophysical survey to delineate the fresh-saline groundwater interface and associated sub-bottom sedimentary structures beneath Indian River Bay, Delaware, was carried out in April 2010. This included surveying at higher spatial resolution in the vicinity of a study site at Holts Landing, where intensive onshore and offshore studies were subsequently completed. The total length of continuous resistivity profiling (CRP) survey lines was 145 kilometers (km), with 36 km of chirp seismic lines surveyed around the perimeter of the bay. Medium-resolution CRP surveying was performed using a 50-meter streamer in a bay-wide grid. Results of the surveying and data inversion showed the presence of many buried paleochannels beneath Indian River Bay that generally extended perpendicular from the shoreline in areas of modern tributaries, tidal creeks, and marshes. An especially wide and deep paleochannel system was imaged in the southeastern part of the bay near White Creek. Many paleochannels also had high-resistivity anomalies corresponding to low-salinity groundwater plumes associated with them, likely due to the presence of fine-grained estuarine mud and peats in the channel fills that act as submarine confining units. Where present, these units allow plumes of low-salinity groundwater that was recharged onshore to move beyond the shoreline, creating a complex fresh-saline groundwater interface in the subsurface. The properties of this interface are important considerations in construction of accurate coastal groundwater flow models. These models are required to help predict how nutrient-rich groundwater, recharged in agricultural watersheds such as this one, makes its way into coastal bays and impacts surface water quality and estuarine ecosystems. For more information on the survey conducted for this project, see <http://woodshole.er.usgs.gov/operations/ia/public_ds_info.php?fa=2010-006-FA>.
  1. How should this data set be cited?

    Cross, VeeAnn A. , 2014, IRB_BATHY_GEO.TIFF: Depth-colored GeoTIFF image of the bathymetry of Indian River Bay, Delaware, generated from fathometer data acquired in April 2010 during U.S. Geological Survey Field Activity 2010-006-FA (Geographic, WGS 84): Open-File Report 2011-1039, U.S. Geological Survey, Coastal and Marine Geology Program, Woods Hole Coastal and Marine Science Center, Woods Hole, MA.

    Online Links:

    This is part of the following larger work.

    Cross, V.A., Bratton, J.F., Michael, H.A., Kroeger, K.D., Green, A., and Bergeron, E., 2014, Continuous Resistivity Profiling and Seismic-Reflection Data Collected in April 2010 from Indian River Bay, Delaware: Open-File Report 2011-1039, U.S. Geological Survey, Reston, VA.

    Online Links:

  2. What geographic area does the data set cover?

    West_Bounding_Coordinate: -75.207119
    East_Bounding_Coordinate: -75.060608
    North_Bounding_Coordinate: 38.621180
    South_Bounding_Coordinate: 38.565589

  3. What does it look like?

    <http://pubs.usgs.gov/of/2011/1039/data/basemap/irb_bathy_geo.gif> (GIF)
    Thumbnail GIF image showing the color-coded bathymetry in Indian River Bay. The coastline is included for spatial reference.

  4. Does the data set describe conditions during a particular time period?

    Beginning_Date: 12-Apr-2010
    Ending_Date: 15-Apr-2010
    Currentness_Reference: ground condition

  5. What is the general form of this data set?

    Geospatial_Data_Presentation_Form: remote-sensing image

  6. How does the data set represent geographic features?

    1. How are geographic features stored in the data set?

      This is a Raster data set. It contains the following raster data types:

      • Dimensions 218 x 731 x 1, type Pixel

    2. What coordinate system is used to represent geographic features?

      Horizontal positions are specified in geographic coordinates, that is, latitude and longitude. Latitudes are given to the nearest 0.000255. Longitudes are given to the nearest 0.000200. Latitude and longitude values are specified in Decimal degrees.

      The horizontal datum used is D_WGS_1984.
      The ellipsoid used is WGS_1984.
      The semi-major axis of the ellipsoid used is 6378137.000000.
      The flattening of the ellipsoid used is 1/298.257224.

      Vertical_Coordinate_System_Definition:
      Altitude_System_Definition:
      Altitude_Datum_Name: National Geodetic Vertical Datum of 1929
      Altitude_Resolution: 0.1
      Altitude_Distance_Units: meters
      Altitude_Encoding_Method: Implicit coordinate

  7. How does the data set describe geographic features?

    irb_bathy_geo.tif.vat

    ObjectID
    Internal feature number. (Source: ESRI)

    Sequential unique whole numbers that are automatically generated.

    Value

    Red

    Green

    Blue

    Opacity

    Count

    Entity_and_Attribute_Overview:
    This image is based on a bathymetry grid which is in meters in the vertical datum of NGVD29. Based on the NOAA website (<http://www.ngs.noaa.gov/cgi-bin/VERTCON/vert_con.prl> accessed October 2010) the conversion from NGVD29 to NAVD88 is -0.238 meters at both the Indian River Inlet tide station and the Rosedale Beach tide station. This indicates a direct offset of the whole grid will convert to NAVD88. So taking this grid and subtracting 0.238 meters will yield a grid with the vertical datum NAVD88. The colormap in the image uses red to indicate the shallowest areas. Then moving to deeper water - yellow, greens, and dark blue is the deepest.


Who produced the data set?

  1. Who are the originators of the data set? (may include formal authors, digital compilers, and editors)

  2. Who also contributed to the data set?

  3. To whom should users address questions about the data?

    VeeAnn A. Cross
    U.S. Geological Survey
    Marine Geologist
    Woods Hole Coastal and Marine Science Center
    Woods Hole, MA 02543-1598

    (508) 548-8700 x2251 (voice)
    (508) 457-2310 (FAX)
    vatnipp@usgs.gov


Why was the data set created?

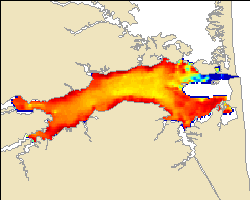
The purpose of this dataset is to provide a color GeoTIFF image in the geographic, WGS84 coordinate system of the tide corrected bathymetric grid for the Indian River Bay.


How was the data set created?

  1. From what previous works were the data drawn?

  2. How were the data generated, processed, and modified?

    Date: Mar-2011 (process 1 of 4)
    Used Mirone version 1.5.0 standalone software to read the binary grid (irb_bathy). Used Image - Color Palettes - Change Palette to choose an appropriate color scale and stetch the bottom of the color range to account for the large amount of shallow data. Then File - Save Image As - GeoTIFF. Output file to irb_bathy.tif and selected the option to preserve image original size. This process step, along with all subsequent process steps, was performed by the same person: VeeAnn A. Cross.

    Person who carried out this activity:

    VeeAnn A. Cross
    U.S. Geological Survey
    Marine Geologist
    384 Woods Hole Rd.
    Woods Hole, MA 02543-1598

    (508) 548-8700 x2251 (voice)
    (508) 457-2310 (FAX)
    vatnipp@usgs.gov

    Data sources used in this process:
    • irb_bathy

    Data sources produced in this process:

    • irb_bathy.tif

    Date: Mar-2011 (process 2 of 4)
    Used GeoTIFF Examine to write the header information from the GeoTIFF to a TIFF world file.

    Data sources used in this process:

    • irb_bathy.tif

    Data sources produced in this process:

    • irb_bathy.tfw

    Date: Mar-2011 (process 3 of 4)
    Loaded the UTM image into ArcMap 9.2, then right-mouse click - data -export. Used the extent of the raster dataset and the spatial reference of the data fram (geographic, WGS84). Set the format to TIFF and saved the image as irb_bathy_geo.tif.

    Data sources used in this process:

    • irb_bathy.tif

    Data sources produced in this process:

    • irb_bathy_geo.tif

    Date: Mar-2011 (process 4 of 4)
    Used GeoTIFF Examine to write the header information from the GeoTIFF to a TIFF world file.

    Data sources used in this process:

    • irb_bathy_geo.tif

    Data sources produced in this process:

    • irb_bathy_geo.tfw

  3. What similar or related data should the user be aware of?


How reliable are the data; what problems remain in the data set?

  1. How well have the observations been checked?

  2. How accurate are the geographic locations?

    The navigation system used was a Lowrance 480M with an LGC-2000 Global Positioning System (GPS) antenna. The antenna was located directly above the fathometer transducer mount point.

  3. How accurate are the heights or depths?

    All collected bathymetry values were collected by the 200 kHz Lowrance fathometer. The fathometer was mounted starboard side aft, directly below the GPS antenna and the resistivity streamer tow point. The Lowrance manufacturer indicates the speed of sound used by the system to convert to depths is 4800 feet/second. All values are assumed to be accurate to within 1 meter. The gridding, grid smoothing, and other processing affects the accuracy of individual cell values as these data were not collected with the intention of generating a grid and have areas of sparse coverage. This image does not actually have depth values. The colormap of the image is used to indicate depths where red indicates teh shallowest areas. Then moving to deeper water indicated by hellow, greens and darkblue (for the deepest water).

  4. Where are the gaps in the data? What is missing?

    This GeoTIFF image represents all the valid fathometer readings recorded by the HYPACK navigation software, plus some bathymetric readings recorded by the continuous resistivity profile system when the HYPACK system was not logging data.

  5. How consistent are the relationships among the observations, including topology?

    All the data were evaluated with the same criteria.


How can someone get a copy of the data set?

Are there legal restrictions on access or use of the data?

Access_Constraints: None.
Use_Constraints:
Not to be used for navigation. The public domain data from the U.S. Government are freely redistributable with proper metadata and source attribution. Please recognize the U.S. Geological Survey as the originator of the dataset.

  1. Who distributes the data set? (Distributor 1 of 1)

    VeeAnn A. Cross
    U.S. Geological Survey
    Marine Geologist
    Woods Hole Coastal and Marine Science Center
    Woods Hole, MA 02543-1598

    (508) 548-8700 x2251 (voice)
    (508) 457-2310 (FAX)
    vatnipp@usgs.gov

  2. What's the catalog number I need to order this data set?

    Downloadable Data

  3. What legal disclaimers am I supposed to read?

    Neither the U.S. government, the Department of the Interior, nor the USGS, nor any of their employees, contractors, or subcontractors, make any warranty, express or implied, nor assume any legal liability or responsibility for the accuracy, completeness, or usefulness of any information, apparatus, product, or process disclosed, nor represent that its use would not infringe on privately owned rights. The act of distribution shall not constitute any such warranty, and no responsibility is assumed by the USGS in the use of these data or related materials. Any use of trade, product, or firm names is for descriptive purposes only and does not imply endorsement by the U.S. Government.

  4. How can I download or order the data?

  5. What hardware or software do I need in order to use the data set?

    This zip file contains data available in GeoTIFF format with an accompanying TIFF world file. The user must have software capable of uncompressing the zip file and reading/displaying the image.


Who wrote the metadata?

Dates:
Last modified: 30-Jun-2014
Metadata author:
VeeAnn A. Cross
U.S. Geological Survey
Marine Geologist
Woods Hole Coastal and Marine Science Center
Woods Hole, MA 02543-1598

(508) 548-8700 x2251 (voice)
(508) 457-2310 (FAX)
vatnipp@usgs.gov

Metadata standard:
FGDC Content Standards for Digital Geospatial Metadata (FGDC-STD-001-1998)
Metadata extensions used:


Generated by mp version 2.9.6 on Mon Jun 30 15:28:40 2014