allswathi_5m - Composite swath bathymetry gridded data collected by the U.S. Geological Survey surrounding the eastern Elizabeth Islands and northern Martha's Vineyard, MA, 2011 (Esri grid, UTM Zone19 N, WGS 84, 5-m resolution)

Metadata also available as - [Outline] - [Parseable text] - [XML]

Frequently anticipated questions:


What does this data set describe?

Title:
allswathi_5m - Composite swath bathymetry gridded data collected by the U.S. Geological Survey surrounding the eastern Elizabeth Islands and northern Martha's Vineyard, MA, 2011 (Esri grid, UTM Zone19 N, WGS 84, 5-m resolution)
Abstract:
These data were collected under a cooperative agreement between the Massachusetts Office of Coastal Zone Management (CZM) and the U.S. Geological Survey (USGS), Coastal and Marine Geology Program, Woods Hole Coastal and Marine Science Center (WHCMSC). Initiated in 2003, the primary objective of this program is to develop regional geologic framework information for the management of coastal and marine resources. Accurate data and maps of seafloor geology are important first steps toward protecting fish habitat, delineating marine resources, and assessing environmental changes due to natural or human impacts. The project is focused on the inshore waters of coastal Massachusetts, primarily in water depths of 2-30 meters. Data collected for the mapping cooperative have been released in a series of USGS Open-File Reports (<http://woodshole.er.usgs.gov/project-pages/coastal_mass/html/current_map.html>). The data collected in this study area are located in both Buzzards Bay and Vineyard Sound and are primarily in the shallow water areas around the eastern Elizabeth Islands and Martha's Vineyard, Massachusetts. The data include high resolution bathymetry, acoustic-backscatter intensity, sound velocity in water, seismic-reflection profiles, and navigation data. These data were collected during several cruises between 2007 and 2011 onboard the R/V Rafael using the following equipment: an SEA Ltd SwathPlus interferometric sonar (234 kHz), Klein 3000 dual frequency sidescan sonar, a boomer source and Geometrics 8-channel GeoEel streamer, a Knudsen 3200 subbottom profiling system, and 4 GPS antennae. More information about the cruises conducted as part of the project: Geologic Mapping of the Seafloor Offshore of Massachusetts can be found on the Woods Hole Coastal and Marine Science Center Field Activity webpages: <http://woodshole.er.usgs.gov/operations/ia/public_ds_info.php?fa=2011-013-FA> <http://woodshole.er.usgs.gov/operations/ia/public_ds_info.php?fa=2009-068-FA> <http://woodshole.er.usgs.gov/operations/ia/public_ds_info.php?fa=2007-039-FA><http://woodshole.er.usgs.gov/operations/ia/public_ds_info.php?fa=2010-100-FA><http://woodshole.er.usgs.gov/operations/ia/public_ds_info.php?fa=2010-047-FA>
  1. How should this data set be cited?

    U.S. Geological Survey, 2013, allswathi_5m - Composite swath bathymetry gridded data collected by the U.S. Geological Survey surrounding the eastern Elizabeth Islands and northern Martha's Vineyard, MA, 2011 (Esri grid, UTM Zone19 N, WGS 84, 5-m resolution): Open-File Report 2013-1020, U.S. Geological Survey, Coastal and Marine Geology Program, Woods Hole Coastal and Marine Science Center, Woods Hole, Massachusetts.

    Online Links:

    This is part of the following larger work.

    Pendleton, Elizabeth A., Andrews, Brian D., Danforth, William W., and Foster, David S., 2013, High-Resolution Geophysical Data From Sand Shoals of Vineyard Sound and the Sea Floor Surrounding the Eastern Elizabeth Islands, Massachusetts: Open-File Report 2013-1020, U.S. Geological Survey, Reston, VA.

    Online Links:

  2. What geographic area does the data set cover?

    West_Bounding_Coordinate: -70.829340
    East_Bounding_Coordinate: -70.444026
    North_Bounding_Coordinate: 41.554382
    South_Bounding_Coordinate: 41.431981

  3. What does it look like?

    <http://pubs.usgs.gov/of/2013/1020/GIS_catalog/bathy/all/all_5m.png> (PNG)
    Woods Hole Coastal and Marine Science Center Swath interferometric bathymetry surrounding the Elizabeth Islands and Martha's Vineyard, MA

  4. Does the data set describe conditions during a particular time period?

    Beginning_Date: 05-Nov-2007
    Ending_Date: 31-Aug-2011
    Currentness_Reference:
    Middle Ground data were collected on 20071105, 20071207, and 20090922. Survey 2011-013-FA was conducted 20110802 to 20110831. Data were not collected on 20110807, 20110812-20110815, 20110821, and 20110825-20110829 due to weather.

  5. What is the general form of this data set?

    Geospatial_Data_Presentation_Form: raster digital data

  6. How does the data set represent geographic features?

    1. How are geographic features stored in the data set?

      This is a Raster data set. It contains the following raster data types:

      • Dimensions 2598 x 6386 x 1, type Grid Cell

    2. What coordinate system is used to represent geographic features?

      Grid_Coordinate_System_Name: Universal Transverse Mercator
      Universal_Transverse_Mercator:
      UTM_Zone_Number: 19
      Transverse_Mercator:
      Scale_Factor_at_Central_Meridian: 0.999600
      Longitude_of_Central_Meridian: -69.000000
      Latitude_of_Projection_Origin: 0.000000
      False_Easting: 500000.000000
      False_Northing: 0.000000

      Planar coordinates are encoded using row and column
      Abscissae (x-coordinates) are specified to the nearest 5.000000
      Ordinates (y-coordinates) are specified to the nearest 5.000000
      Planar coordinates are specified in meters

      The horizontal datum used is D_WGS_1984.
      The ellipsoid used is WGS_1984.
      The semi-major axis of the ellipsoid used is 6378137.000000.
      The flattening of the ellipsoid used is 1/298.257224.

      Vertical_Coordinate_System_Definition:
      Depth_System_Definition:
      Depth_Datum_Name: Mean Lower Low Water
      Depth_Resolution: 0.1
      Depth_Distance_Units: meters
      Depth_Encoding_Method:
      Explicit elevation coordinate included with horizontal coordinates

  7. How does the data set describe geographic features?


Who produced the data set?

  1. Who are the originators of the data set? (may include formal authors, digital compilers, and editors)

  2. Who also contributed to the data set?

  3. To whom should users address questions about the data?

    Elizabeth A. Pendleton
    U.S. Geological Survey
    Geologist
    384 Woods Hole Road
    Woods Hole, MA 02543-1598
    USA

    508-548-8700 x2259 (voice)
    508-457-2310 (FAX)
    ependleton@usgs.gov


Why was the data set created?

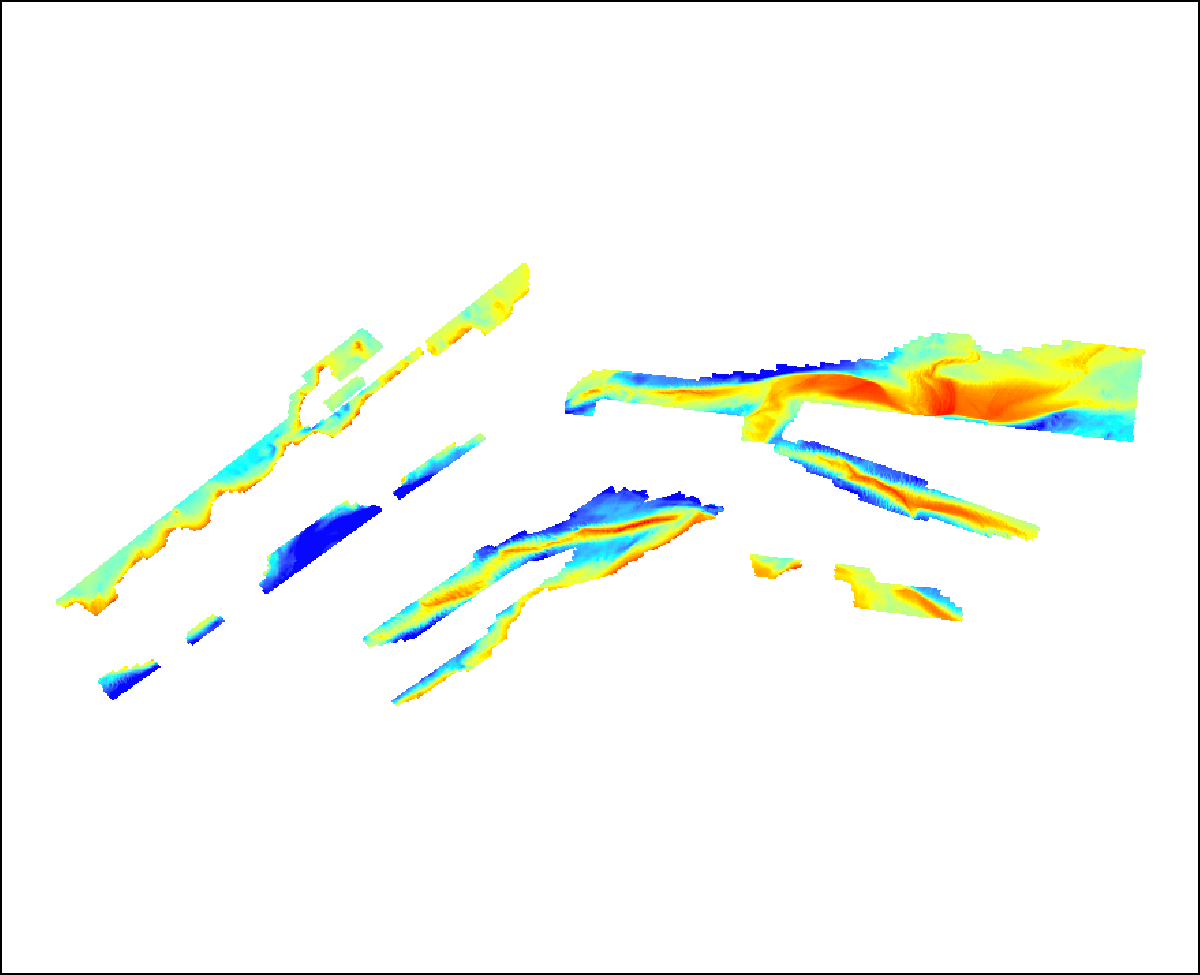
This grid represents approximately 69 square km of bathymetric data that were collected between 2007 and 2011. These data are used to define the sea-floor morphology surrounding the nearshore of the eastern Elizabeth Islands and sand shoals of Vineyard Sound, Massachusetts. This interpolated grid provides a representation of the seafloor for sand shoals and nearshore areas and can be used for seafloor characterization


How was the data set created?

  1. From what previous works were the data drawn?

    2011-013-FA (source 1 of 2)
    Pendleton, E.A., Andrews, B.D., Danforth, W.W., and Foster, D.S, 2013, fa2011013_2m - Swath bathymetry gridded data collected by the U.S. Geological Survey - Woods Hole Coastal and Marine Science Center surrounding the eastern Elizabeth Islands and northern Martha's Vineyard, MA, 2011 (Esri grid, UTM Zone19N, WGS 84): Open-File Report 2013-1020, U.S. Geological Survey, Woods Hole Coastal and Marine Science Center, Woods Hole, MA.

    Online Links:

    Type_of_Source_Media: disc
    Source_Contribution:
    Bathymetric xyz data from sand shoals in Vineyard Sound and around the Elizabeth Islands (2011-013-FA) were used to create an interpolated continuous surface grid of sand shoals and nearshore areas of Buzzards Bay and Vineyard Sound.

    2007-039-FA, and 2009-068-FA (source 2 of 2)
    Pendleton, E.A., Andrews, B.D., Danforth, W.W., and Foster, D.S., 2013, mg-2m - Swath bathymetry gridded data collected by the U.S. Geological Survey - Woods Hole Coastal and Marine Science Center on Middle Ground Shoal, Massachusetts, 2007-2009 (Esri grid, UTM Zone19N, WGS 84): Open-File Report 2013-1020, U.S. Geological Survey, Woods Hole Coastal and Marine Science Center, Woods Hole, MA.

    Online Links:

    Type_of_Source_Media: disc
    Source_Contribution:
    Bathymetric xyz data from Middle Ground surveys (2007-039-FA and 2009-068-FA) were used to create an interpolated continuous surface grid of sand shoals and nearshore areas of Buzzards Bay and Vineyard Sound.

  2. How were the data generated, processed, and modified?

    Date: 2013 (process 1 of 1)
    2 meter horizontal resolution tide corrected base surfaces, that were finalized and exported from CARIS for each of the source grids (excluding all transit lines this time for survey 2011-013-FA), were gridded in ArcMap (version 9.3.1). To do this, the xyz files were converted to shapefiles in ArcCatalog and merged using the merge function in ArcToolBox. 3D Analyst natural neighbor grid function was used to create an interpolated grid surface at a 5-m horizontal resolution from the combined Middle Ground and sand shoal and Elizabeth Islands point (shapefile) datasets. A shapefile of the study area was used to clip the grid to the extent of the surveyed area.

    Person who carried out this activity:

    Elizabeth A. Pendleton
    U.S. Geological Survey
    Geologist
    384 Woods Hole Rd.
    Woods Hole, MA 02543-1598

    (508) 548-8700x2259 (voice)
    (508) 457-2310 (FAX)
    ependleton@usgs.gov

  3. What similar or related data should the user be aware of?

    Andrews, B.D., Ackerman, S.D., Baldwin, W.E., Foster, D.S., and Schwab, W.C., 2013, High-Resolution Geophysical Data From the Inner Continental Shelf at Vineyard Sound, Massachusetts: Open-File Report 2012-1006, U.S. Geological Survey, Woods Hole Coastal and Marine Science Center, Woods Hole, Massachusetts.

    Online Links:

    Ackerman, S.D., Andrews, B.D., Foster, D.S., Baldwin, W.E., and Schwab, W.C., 2013, High-Resolution Geophysical Data from the Inner Continental Shelf: Buzzards Bay, Massachusetts: Open-File Report 2012-1002, U.S. Geological Survey, Woods Hole Coastal and Marine Science Center, Woods Hole, MA.

    Online Links:

    Pendleton, E.A., Twichell, D.C., Foster, D.S., Worley, C.R., Irwin, B.J., and Danforth, W.W., 2012, High-Resolution Geophysical Data From the Sea Floor Surrounding the Western Elizabeth Islands, Massachusetts: Open-File Report 2011-1184, U.S. Geological Survey, Woods Hole Coastal and Marine Science Center, Woods Hole, MA.

    Online Links:

    Turecek, A.M., Danforth, W.W., Baldwin, W.E., and Barnhardt, W.A., 2012, High-Resolution Geophysical Data Collected Within Red Brook Harbor, Buzzards Bay, Massachusetts, in 2009: Open-File Report 2010-1091, U.S. Geological Survey, Woods Hole Coastal and Marine Science Center, Woods Hole, MA.

    Online Links:

    Calder, B.R., 2003, Automatic Statistical Processing of Multibeam Echosounder Data: International Hydrographic Review Volume 4, INT HYDROGRAPHIC BUREAU, The Netherlands.


How reliable are the data; what problems remain in the data set?

  1. How well have the observations been checked?

  2. How accurate are the geographic locations?

    The navigation for these data was acquired with a Coda Octopus F180 Differential Global Positioning System + Wide Area Augmentation System (DGPS+WAAS); they are accurate to + or - 1 to 2 meters, horizontally. All DGPS data are referenced to WGS 84, and vertical distance between the pole-mounted interferometric sonar head, 0.5m below the sea surface, and the DGPS antenna located on the same pole on the bow of the R/V Rafael, 2.5 m above the sea surface, are corrected.

  3. How accurate are the heights or depths?

    The theoretical vertical accuracy of the SEA Ltd SwathPlus interferometric sonar is 1 % of water depth, approximately 0.01 to 0.38 m within the study area. An Octopus F180 Attitude and Positioning system was used to correct for vessel roll, pitch, heave, and yaw, which has a theoretical vertical accuracy of a few mm. Tidal offsets were corrected to MLLW using RTK GPS heights. Field tests using submerged targets suggest that the vertical accuracy of the RTK tidal correction is less than 30 cm. Gridding algorithms and cell sizes for these data could introduce errors as great as 3 m along the edges of the data. Gridding-induced errors are likely much smaller (< 0.2 m) for most of the study. Changes in ship draft due to water and fuel usage were not considered. Total vertical accuracy for these data are assumed to be + or - 50 cm.

  4. Where are the gaps in the data? What is missing?

    Swathplus bathymetry data from cruise 2011-013-FA, 2009-068, and 2007-039 were used to generate this grid with the exception of transit lines.

  5. How consistent are the relationships among the observations, including topology?

    No additional editing of the input source data was conducted.


How can someone get a copy of the data set?

Are there legal restrictions on access or use of the data?

Access_Constraints: None
Use_Constraints:
Not to be used for navigation. The Public domain data from the U.S. Government are freely redistributable with proper metadata and source attribution. Please recognize the U.S. Geological Survey as the originator of the dataset.

  1. Who distributes the data set? (Distributor 1 of 1)

    Elizabeth A. Pendleton
    U.S. Geological Survey
    Geologist
    384 Woods Hole Rd.
    Woods Hole, MA 02543-1598

    (508) 548-8700x2259 (voice)
    (508) 457-2310 (FAX)
    ependleton@usgs.gov

  2. What's the catalog number I need to order this data set?

    Downloadable Data

  3. What legal disclaimers am I supposed to read?

    Neither the U.S. Government, the Department of the Interior, nor the USGS, nor any of their employees, contractors, or subcontractors, make any warranty, express or implied, nor assume any legal liability or responsibility for the accuracy, completeness, or usefulness of any information, apparatus, product, or process disclosed, nor represent that its use would not infringe on privately owned rights. The act of distribution shall not constitute any such warranty, and no responsibility is assumed by the USGS in the use of these data or related materials. Any use of trade, product, or firm names is for descriptive purposes only and does not imply endorsement by the U.S. Government.

  4. How can I download or order the data?

  5. What hardware or software do I need in order to use the data set?

    The grid contained in the .zip file is available as an Esri binary grid. To utilize this data, the user must have a GIS software package capable of reading an Esri binary grid.


Who wrote the metadata?

Dates:
Last modified: 30-Oct-2013
Metadata author:
Elizabeth Pendleton
U.S. Geological Survey
Geologist
384 Woods Hole Rd.
Woods Hole, MA 02543-1598

(508) 548-8700x2259 (voice)
(508) 457-2310 (FAX)
ependleton@usgs.gov

Metadata standard:
FGDC Content Standards for Digital Geospatial Metadata (FGDC-STD-001-1998)
Metadata extensions used:


Generated by mp version 2.9.21 on Wed Oct 30 15:23:25 2013