Sound velocity profiles (SVPs) in CSV format and PNG image format collected by the U.S. Geological Survey in the nearshore surrounding the Elizabeth Islands and sand shoals of Vineyard Sound, MA, 2007, 2009, and 2011

Metadata also available as - [Outline] - [Parseable text] - [XML]

Frequently anticipated questions:


What does this data set describe?

Title:
Sound velocity profiles (SVPs) in CSV format and PNG image format collected by the U.S. Geological Survey in the nearshore surrounding the Elizabeth Islands and sand shoals of Vineyard Sound, MA, 2007, 2009, and 2011
Abstract:
These data were collected under a cooperative agreement between the Massachusetts Office of Coastal Zone Management (CZM) and the U.S. Geological Survey (USGS), Coastal and Marine Geology Program, Woods Hole Coastal and Marine Science Center (WHCMSC). Initiated in 2003, the primary objective of this program is to develop regional geologic framework information for the management of coastal and marine resources. Accurate data and maps of seafloor geology are important first steps toward protecting fish habitat, delineating marine resources, and assessing environmental changes due to natural or human impacts. The project is focused on the inshore waters of coastal Massachusetts, primarily in water depths of 2-30 meters. Data collected for the mapping cooperative have been released in a series of USGS Open-File Reports (<http://woodshole.er.usgs.gov/project-pages/coastal_mass/html/current_map.html>). The data collected in this study area are located in both Buzzards Bay and Vineyard Sound and are primarily in the shallow water areas around the eastern Elizabeth Islands and Martha's Vineyard, Massachusetts. The data include high resolution bathymetry, acoustic-backscatter intensity, sound velocity in water, seismic-reflection profiles, and navigation data. These data were collected during several cruises between 2007 and 2011 onboard the R/V Rafael using the following equipment: an SEA Ltd SwathPlus interferometric sonar (234 kHz), Klein 3000 dual frequency sidescan sonar, a boomer source and Geometrics 8-channel GeoEel streamer, a Knudsen 3200 subbottom profiling system, and 4 GPS antennae. More information about the cruises conducted as part of the project: Geologic Mapping of the Seafloor Offshore of Massachusetts can be found on the Woods Hole Coastal and Marine Science Center Field Activity webpages: <http://woodshole.er.usgs.gov/operations/ia/public_ds_info.php?fa=2011-013-FA> <http://woodshole.er.usgs.gov/operations/ia/public_ds_info.php?fa=2009-068-FA> <http://woodshole.er.usgs.gov/operations/ia/public_ds_info.php?fa=2007-039-FA><http://woodshole.er.usgs.gov/operations/ia/public_ds_info.php?fa=2010-100-FA><http://woodshole.er.usgs.gov/operations/ia/public_ds_info.php?fa=2010-047-FA>
  1. How should this data set be cited?

    U.S. Geological Survey, 2013, Sound velocity profiles (SVPs) in CSV format and PNG image format collected by the U.S. Geological Survey in the nearshore surrounding the Elizabeth Islands and sand shoals of Vineyard Sound, MA, 2007, 2009, and 2011: Open-File Report 2013-1020, U.S. Geological Survey, Coastal and Marine Geology Program, Woods Hole Coastal and Marine Science Center, Woods Hole, Massachusetts.

    Online Links:

    This is part of the following larger work.

    Pendleton, Elizabeth A., Andrews, Brian D., Danforth, William W., and Foster, David S., 2013, High-Resolution Geophysical Data From Sand Shoals of Vineyard Sound and the Sea Floor Surrounding the Eastern Elizabeth Islands, Massachusetts: Open-File Report 2013-1020, U.S. Geological Survey, Reston, VA.

    Online Links:

  2. What geographic area does the data set cover?

    West_Bounding_Coordinate: -70.978214
    East_Bounding_Coordinate: -70.850051
    North_Bounding_Coordinate: 41.459365
    South_Bounding_Coordinate: 41.395991

  3. What does it look like?

    <http://pubs.usgs.gov/of/2013/1020/GIS_catalog/svps/svp_image.png> (PNG)
    Example of a sound velocity profile in Vineyard Sound and Buzzards Bay, MA

  4. Does the data set describe conditions during a particular time period?

    Beginning_Date: 05-Nov-2007
    Ending_Date: 31-Aug-2011
    Currentness_Reference:
    Middle Ground data were collected on 20071105, 20071207, and 20090922. Survey 2011-013-FA was conducted 20110802 to 20110831. Data were not collected on 20110807, 20110812-20110815, 20110821, and 20110825-20110829 due to weather.

  5. What is the general form of this data set?

    Geospatial_Data_Presentation_Form: tabular digital data

  6. How does the data set represent geographic features?

    1. How are geographic features stored in the data set?

      This is a Point data set.

    2. What coordinate system is used to represent geographic features?

      Vertical_Coordinate_System_Definition:
      Depth_System_Definition:
      Depth_Datum_Name: Local surface
      Depth_Resolution: 0.1
      Depth_Distance_Units: meters
      Depth_Encoding_Method: Attribute values

  7. How does the data set describe geographic features?

    Entity_and_Attribute_Overview:
    Although these PNG images and CSV format data files do not have coordinates associated with the data themselves, they are related to the SVP locations (shapefile: SVPprofile_locs.shp) by the cast number in the attribute table. Although the header was removed on the CSV files during processing, the first column of data is water depth in meters below the surface and column 2 is speed of sound in meters per second.
    Entity_and_Attribute_Detail_Citation: U.S. Geological Survey


Who produced the data set?

  1. Who are the originators of the data set? (may include formal authors, digital compilers, and editors)

  2. Who also contributed to the data set?

  3. To whom should users address questions about the data?

    Elizabeth A. Pendleton
    U.S. Geological Survey
    Geologist
    384 Woods Hole Road
    Woods Hole, MA 02543-1598
    USA

    508-548-8700 x2259 (voice)
    508-457-2310 (FAX)
    ependleton@usgs.gov


Why was the data set created?

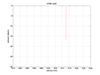
This dataset is used to show the sound velocity profiles collected during USGS cruises within the nearshore surrounding the Elizabeth Islands and along sand shoals in Vineyard Sound, MA. The information contained within the sound velocity profiles (speed of sound in sea water) is needed to adequately account for refraction artifacts that may be present within raw swath bathymetric data. This dataset contains graph images of the sound velocity profile at each station location and commas separated text that shows the change of velocity with water depth.


How was the data set created?

  1. From what previous works were the data drawn?

    (source 1 of 1)
    U.S. Geological Survey.

    Type_of_Source_Media: disc
    Source_Contribution:
    Sound velocity profiles are acquired in order to measure the speed of sound in the water column during survey operations. This information is used to help correct any refraction artifacts that may be present within the swath bathymetric data due to unaccounted for changes in the speed of sound throughout the water column. A Valeport measures sound velocity at the head of the swath interferometric sonar, and these data are supplied directly to the raw swath data. However, additional information about the change in the speed of sound within the water column is necessary and provided through these sound velocity profiles.

  2. How were the data generated, processed, and modified?

    Date: 2013 (process 1 of 2)
    Profiles were collected at least once during each survey day, and multiple times per day when the data suggested significant stratification within the water column. Sound velocity casts were collected using an Applied Microsystems SV Plus v2 instrument (see <http://www.appliedmicrosystems.com/products/productDetails.aspx?id=1> for details). At each station, the SV plus 2 was hand deployed and slowly lowered to the seafloor. The SV plus v2 was monitored by a member of the science party and as the instrument made contact with the seafloor, the position (i.e. location) was recorded in the lab using HYPACK navigation software. The position was then manually recorded within the cruise log and SWATHplus acquisition software. Upon recovery, the SV plus was connected to an onboard computer via serial port in order to download data using the SV plus v2 communications software, SmartTalk. Raw SVP data (text format) were edited using awk to remove the header information and remove data columns except water depth (pressure) and speed of sound.

    Person who carried out this activity:

    Elizabeth A. Pendleton
    U.S. Geological Survey
    Geologist
    384 Woods Hole Rd.
    Woods Hole, MA 02543-1598

    (508) 548-8700x2259 (voice)
    (508) 457-2310 (FAX)
    ependleton@usgs.gov

    Date: 2013 (process 2 of 2)
    The data were then saved as comma-delimited text format and imported to MATLAB using csvread (version R2011a). Graphs of the sound velocity profile (Pressure vs. speed of sound) at each station were created within MATLAB and exported as *.png files.

    Person who carried out this activity:

    Elizabeth A. Pendleton
    U.S. Geological Survey
    Geologist
    384 Woods Hole Rd.
    Woods Hole, MA 02543-1598

    (508) 548-8700x2259 (voice)
    (508) 457-2310 (FAX)
    ependleton@usgs.gov

  3. What similar or related data should the user be aware of?

    Andrews, B.D., Ackerman, S.D., Baldwin, W.E., Foster, D.S., and Schwab, W.C., 2013, High-Resolution Geophysical Data From the Inner Continental Shelf at Vineyard Sound, Massachusetts: Open-File Report 2012-1006, U.S. Geological Survey, Woods Hole Coastal and Marine Science Center, Woods Hole, Massachusetts.

    Online Links:

    Ackerman, S.D., Andrews, B.D., Foster, D.S., Baldwin, W.E., and Schwab, W.C., 2013, High-Resolution Geophysical Data from the Inner Continental Shelf: Buzzards Bay, Massachusetts: Open-File Report 2012-1002, U.S. Geological Survey, Woods Hole Coastal and Marine Science Center, Woods Hole, MA.

    Online Links:

    Pendleton, E.A., Twichell, D.C., Foster, D.S., Worley, C.R., Irwin, B.J., and Danforth, W.W., 2012, High-Resolution Geophysical Data From the Sea Floor Surrounding the Western Elizabeth Islands, Massachusetts: Open-File Report 2011-1184, U.S. Geological Survey, Woods Hole Coastal and Marine Science Center, Woods Hole, MA.

    Online Links:

    Turecek, A.M., Danforth, W.W., Baldwin, W.E., and Barnhardt, W.A., 2012, High-Resolution Geophysical Data Collected Within Red Brook Harbor, Buzzards Bay, Massachusetts, in 2009: Open-File Report 2010-1091, U.S. Geological Survey, Woods Hole Coastal and Marine Science Center, Woods Hole, MA.

    Online Links:


How reliable are the data; what problems remain in the data set?

  1. How well have the observations been checked?

  2. How accurate are the geographic locations?

    Differential Global Positioning System (DGPS) navigation data were acquired with a Communications Systems International (CSI), Inc. LGBX Pro receiver and recorded with HYPACK (www.hypack.com). The CSI received positions from a DGPS antenna located on the port, aft roof of the R/V Rafael cabin. Ship location was used for the sound velocity deployments. The SV plus v2 sound velocity profiler was hand deployed. Once the system reached bottom, positions were read from HYPACK and stored. DGPS accuracy is 1 to 3 meters, depending on the distance from a US Coast Guard coastal repeater station. However, offsets from the location of hand-deployment and the DGPS antenna were not measured, and the ship is allowed to drift during deployment which can last several minutes depending on water depth. The horizontal accuracy of the sound velocity locations is considered to be +/- 50 meters.

  3. How accurate are the heights or depths?

    Water depth of the sound velocity profiles was extracted from the recorded sound velocity profile after recovery. Depth (as pressure in dbars) is recorded as the sound velocity profiler is lowered through the water column and downloaded after the instrument is recovered. Data are stored in ASCII text files. Depth values should be accurate to within 1 meter.

  4. Where are the gaps in the data? What is missing?

    All sound velocity profiles not associated with the patch test collected during cruises 2011-013-FA and 2009-068-FA are included as plotted images. For cruise 2007-039-FA, only data from JD 309 and JD341 were needed to complete the bathymetry coverage over middle ground. JD 304 and JD 305 were excluded from this report because the data were redundant and ran for swath system comparison tests or seismic reflection survey data.

  5. How consistent are the relationships among the observations, including topology?

    All sound velocity profiles were acquired with the same instrument during the cruises; an Applied Microsystems SV plus v2.


How can someone get a copy of the data set?

Are there legal restrictions on access or use of the data?

Access_Constraints: None
Use_Constraints:
Public domain data from the U.S. Government are freely redistributable with proper metadata and source attribution. Please recognize the U.S. Geological Survey as the originator of the dataset.

  1. Who distributes the data set? (Distributor 1 of 1)

    Elizabeth A. Pendleton
    U.S. Geological Survey
    Geologist
    384 Woods Hole Rd.
    Woods Hole, MA 02543-1598

    (508) 548-8700x2259 (voice)
    (508) 457-2310 (FAX)
    ependleton@usgs.gov

  2. What's the catalog number I need to order this data set?

    Downloadable Data

  3. What legal disclaimers am I supposed to read?

    Neither the U.S. Government, the Department of the Interior, nor the USGS, nor any of their employees, contractors, or subcontractors, make any warranty, express or implied, nor assume any legal liability or responsibility for the accuracy, completeness, or usefulness of any information, apparatus, product, or process disclosed, nor represent that its use would not infringe on privately owned rights. The act of distribution shall not constitute any such warranty, and no responsibility is assumed by the USGS in the use of these data or related materials. Any use of trade, product, or firm names is for descriptive purposes only and does not imply endorsement by the U.S. Government.

  4. How can I download or order the data?

  5. What hardware or software do I need in order to use the data set?

    This zip file contains PNG image data that can be viewed with any image viewing software and text data that can be viewed with any text editor.


Who wrote the metadata?

Dates:
Last modified: 25-Oct-2013
Metadata author:
Elizabeth Pendleton
U.S. Geological Survey
Geologist
384 Woods Hole Rd.
Woods Hole, MA 02543-1598

(508) 548-8700x2259 (voice)
(508) 457-2310 (FAX)
ependleton@usgs.gov

Metadata standard:
FGDC Content Standards for Digital Geospatial Metadata (FGDC-STD-001-1998)
Metadata extensions used:


Generated by mp version 2.9.21 on Wed Oct 30 16:08:26 2013