Open-File Report 2013–1063
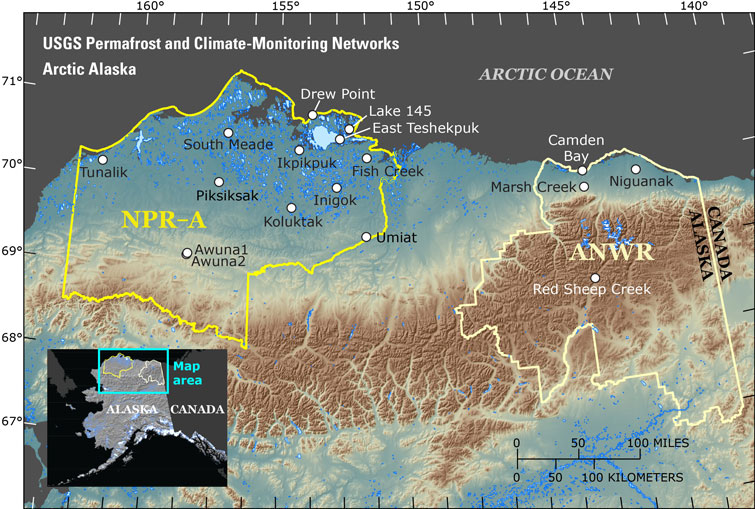
AbstractThis report provides air temperature, wind speed, and wind direction data collected on Federal lands in Arctic Alaska over the period August 1998 to July 2011 by the U.S. Department of the Interior's climate monitoring array, part of the Global Terrestrial Network for Permafrost. In addition to presenting data, this report also describes monitoring, data collection, and quality control methodology. This array of 16 monitoring stations spans 68.5°N to 70.5°N and 142.5°W to 161°W, an area of roughly 150,000 square kilometers. Climate summaries are presented along with provisional quality-controlled data. Data collection is ongoing and includes several additional climate variables to be released in subsequent reports, including ground temperature and soil moisture, snow depth, rainfall, up- and downwelling shortwave radiation, and atmospheric pressure. These data were collected by the U.S. Geological Survey in close collaboration with the Bureau of Land Management and the U.S. Fish and Wildlife Service.
IntroductionBackgroundAtmosphere-ocean general circulation models consistently project the largest climate changes during this century will occur in the Arctic, especially in Arctic Alaska and the adjacent Bering, Beaufort, and Chukchi Seas—that is, lands and portions of the seas managed by the U.S. Department of the Interior (DOI) (Houghton and others, 2001; Arctic Council, 2005; Chapman and Walsh, 2007; Walsh, 2008). Every aspect of the Alaskan Arctic environment is expected to be significantly affected over the next few decades, posing a tremendous land-management challenge for DOI (DeGange and others, 2005; Clow and others, 2011). This region is particularly vulnerable to climate change because of the prevalence of ice-rich permafrost, which is projected to degrade significantly during this century (U.S. Arctic Research Commission, 2003; Lawrence and others, 2008). In Arctic Alaska, permafrost is the foundation upon which terrestrial ecosystems and human infrastructure exist. The indigenous plants and wildlife of this region are highly adapted to extreme conditions, and large projected climate changes are expected to stress these specialized biological systems.
In order for DOI to fulfill its mission in Arctic Alaska,1 it is critical that it has accurate data detailing current environmental conditions and rates of environmental change on its lands. This is particularly true given the high rates of change that are now occurring in the region (Jeffries and others, 2012). Because of the remoteness and harsh environmental conditions in the Arctic and northern Alaska, the observational database of climate change–related variables for the region has been extremely limited. The paucity of baseline environmental data contributes to the uncertainty in future climate projections and climate impact assessments in a number of ways:
Studies by the National Research Council (National Research Council, 2001, 2010) have concluded there is a pressing need for a comprehensive system designed for monitoring climate, particularly in the Arctic, if we are to reduce the uncertainties in future climate projections and the associated climate impacts.
1 The Bureau of Land Management, the U.S. Fish and Wildlife Service, and the Bureau of Ocean Energy Management all have significant management responsibilities for natural resources, wildlife, and the environment in this region.
Description of Monitoring NetworkTo satisfy DOI's need for accurate environmental information and to improve future climate impact assessments, the U.S. Geological Survey has established an array of climate-monitoring stations on Federal lands in Arctic Alaska as part of the U.S. Department of the Interior/Global Terrestrial Network for Permafrost (DOI/GTN-P) Observing System. This array currently consists of 16 automated stations (fig. 1) spanning the National Petroleum Reserve–Alaska and the Arctic National Wildlife Refuge. The first stations were installed during August 1998, so now more than a decade of high-quality observational data are available from some locations (table 1). The stations in the array were gradually added with the goals of spatial and elevation coverage across a range of geomorphic substrates and vegetation regimes. Aspects of the physical environment monitored by these stations include shallow permafrost temperature at 10 depths (5–120 centimeters), active-layer thaw depth and duration, soil moisture, air temperature and pressure, wind speed and direction, up- and downwelling shortwave radiation, surface albedo, snowpack depth and duration, and rainfall (fig. 2). Provisional data from 13 of the stations are currently available in near-real-time (http://data.usgs.gov/climateMonitoring/region/show?region=alaska) using telemetry links to support DOI's land management decisions and a wide range of activities by the Arctic research community. The DOI/GTN-P climate monitoring array is an integral part (through data contribution) of a number of global observing systems, including the Global Terrestrial Network for Permafrost, the Global Terrestrial Observing System, and the Global Climate Observing System. On a regional scale, the stations also contribute to the Circumpolar Active-Layer Monitoring Network and the Arctic Observing Network.
Table 1. Location, elevation, and installation dates for the U.S. Department of the Interior/Global Terrestrial Network for Permafrost (DOI/GTN-P) climate-monitoring stations. Stations in the National Petroleum Reserve–Alaska are listed first, followed by stations in the Arctic National Wildlife Refuge. Also listed are the installation dates for the air temperature and wind-monitoring sensors. Stations in italics transmit their data in near-real-time using telemetry links (http://data.usgs.gov/climateMonitoring/region/show?region=alaska). Station names can be clicked to access climate summaries, data files, and station-specific information.
[APR, April; AUG, August; m, meter]
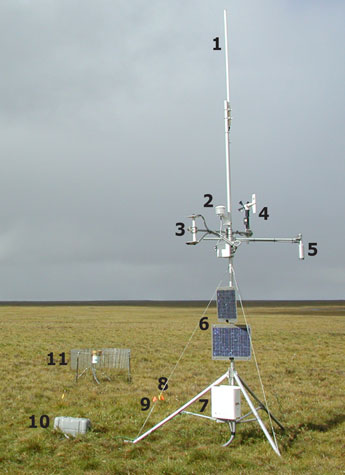
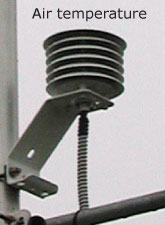
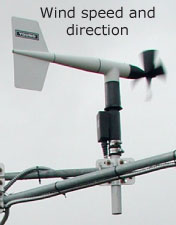
Figure 2. Components of a typical U.S. Department of the Interior/Global Terrestrial Network for Permafrost (DOI/GTN-P) climate-monitoring station. Inset panels (lower right) show the air temperature and wind-monitoring sensors. (cm, centimeters)
Purpose and ScopeHistorically, very little climate information has been collected on Federal lands in Arctic Alaska. The little information that has been collected generally resulted from short-term campaigns designed to support oil development and other activities. This report provides provisional air temperature, wind speed, and wind direction data collected by the DOI/GTN-P climate monitoring array over the period August 1998 through July 2011 that greatly augment the existing record for this region. Because the network took nearly a decade to develop (table 1), the records are of varying lengths. The longest air temperature records cover nearly 13 years (as of July 2011), while the longest wind records cover about 7 years. Although short, the records are long enough to establish climate gradients and patterns across the region, quantify the magnitude of variability on daily through annual timescales, and provide the context for future climate change. Data collection is ongoing. Subsequent reports will provide annual updates and information on the full suite of climate variables monitored by the network.
Data Collection and AnalysisData Collection MethodsEach station consists of a solar- and battery-powered datalogger, a sensor mast, and the sensors (fig. 2). The air temperature measurements are made using a Campbell Scientific (CSI) model 107 thermistor probe mounted in a naturally aspirated 6-gill radiation shield located 3 meters (m) above the surface as measured during the snow-free period. The 107 probe is sampled every 30 seconds (s) by the datalogger (CSI model CR10X or CR1000, depending on the station) using a half-bridge voltage measurement. To reduce measurement uncertainties, voltages are converted to temperature during the data processing step using a 3-term Steinhart-Hart equation (Steinhart and Hart, 1968) appropriate for the full temperature range experienced at these sites (-50°C to +30°C). Wind speed and direction are measured every 30 s using a R.M. Young 05103 wind monitor, located 3 m above the surface. Mean hourly 107 voltages and wind speeds are then stored in the datalogger. For wind direction the hourly vector mean is stored, although prior to April 2008 the arithmetic mean was stored rather than the vector mean. Because of limited power and data storage capacity, averages taken before August 2003 were stored once every two hours rather than hourly. Physical site visits are made 1–2 times per year to collect the stored measurements and to perform station maintenance. For the stations with telemetry (table 1), data are occasionally downloaded between site visits.
Data Processing and Quality ControlBecause of the harsh operating environment, a variety of problems can affect the sensors and resulting data streams. These include loss of system power, total or partial failure of the sensor support mast due to bear activity, destruction of sensor cables or the sensors themselves by wild animals, obstruction of air-temperature radiation shields by snow or rime ice, complete freeze-up of wind sensors by rime ice, obstruction of downwelling radiation detectors by snow, corrosion of snow-depth transducers by high humidity, false snow-depth signals caused by blowing snow, intermittent electrical noise associated with electric bear fences, vertical movement ("jacking") of ground temperature sensors by freeze/thaw forces, and others.A multi-component data processing system has been developed to automatically and consistently handle a number of the data processing tasks, including application of sensor calibration factors, masking data during periods that are known to be problematic, masking data that are outside reasonable predefined limits, calculation of derived climate variables (for example, thawing-degree-days, maximum active-layer depth, total precipitation), calculation of climate statistics on a variety of timescales, and calculation of climate trends and anomalies. The system also includes a number of tools to assist the data technician in identifying spurious data that are missed by the automated routines and require a higher level of analysis. Details of the data processing system are described in "DOI/GTN-P Climate-Station Data, Quality Assurance and Control Procedures" (G.D. Clow and F.E. Urban, unpub. data, 2012). Air temperature resistance ( Rs ) of a 107 sensor can be determined from the stored half-bridge voltage ( V ) using the equation
where Rf and Rb are the resistances of the field and bridge resistors in the half-bridge, respectively, and Vx is the excitation voltage. The excitation voltage can vary slightly, so it is collected each time a measurement is made. Temperature is then calculated from the resistance using the 3-term Steinhart-Hart equation
where T is temperature in Kelvin. For temperatures experienced in Arctic Alaska, we use A=8.46357×10⁻⁴ K-1, B=2.06268×10⁻⁴ K-1, and C=8.69581×10⁻⁸ K-1 for the Steinhart coefficients. Temperature sensor measurements are assigned a bad data code when it is determined they do not represent the air temperature field 3 m above the ground. Data that have been assigned such a code are effectively masked and are not used in any further calculations (for example, climate statistics, climate trends, or climate anomalies). Problems that can lead to air temperature masking include (a) insufficient system power, (b) a change in sensor height due to sensor mast damage, (c) destruction of the sensor cable or of the 107 sensor, (d) reduction of the necessary ventilation through the radiation shield by snow, rime ice, or low wind speeds (<1 m s-1), and (e) the sensor falling out of the radiation shield, exposing it to radiational heating. Air-temperature climate statistics are calculated when the data are available at least 95 percent of the time. No calibration factors or corrections are currently applied to the wind speed or wind direction measurements. Problems that can lead to masking of either the wind speed or wind direction include (a) insufficient system power, (b) a change in sensor height due to sensor mast damage, (c) destruction of the sensor cable or of the wind monitor, and (d) significant ice buildup, preventing the wind monitor from functioning properly. In some cases, icing will affect the wind speed measurements but not the wind direction, and vice versa. The threshold for calculating climate statistics for the wind variables is the same as for air temperature, that is, 95 percent data availability.
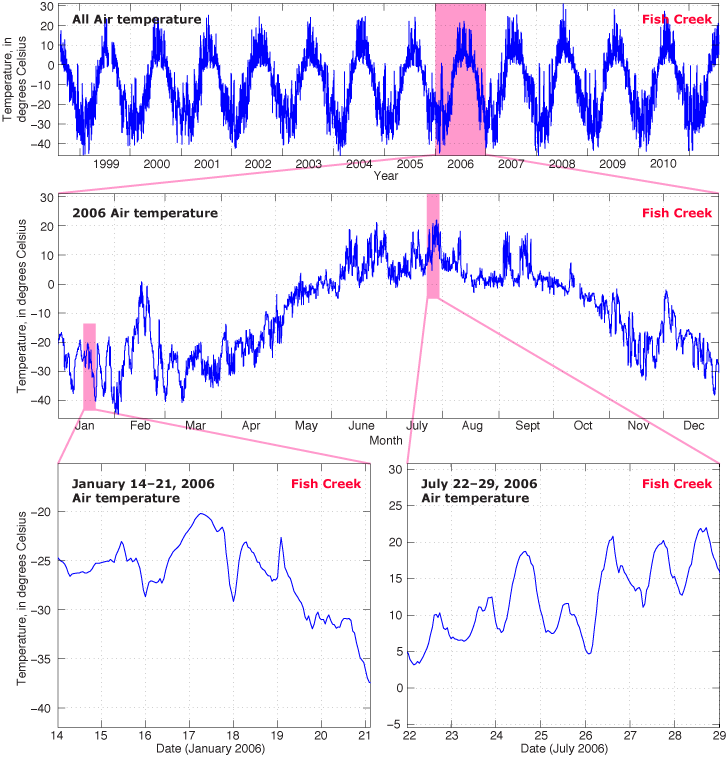
Data OverviewFigures 3–5 present air temperature, wind speed, and wind direction data, respectively, at several temporal scales using the Fish Creek monitoring station (70°20.114'N, 152°03.120'W) as an example. Figure 3 shows the air temperature record from this station at hourly resolution. The top panel shows the full record, the middle panel shows a single year of data, and the lower panels shows one week of winter data and one week of summer data. The annual seasonal cycle is clearly evident in the top panel with minimum winter air temperatures dropping to about -45°C and maximum summer temperatures reaching +25°C. In addition to the seasonal cycle, temperature excursions due to passing weather systems are discernible in the middle panel. These weather systems are the dominant source of air temperature variability during the winter (lower left panel). During the summer, air temperature variations are primarily related to changes in the incident solar flux, which produces a strong diurnal cycle (lower right panel).
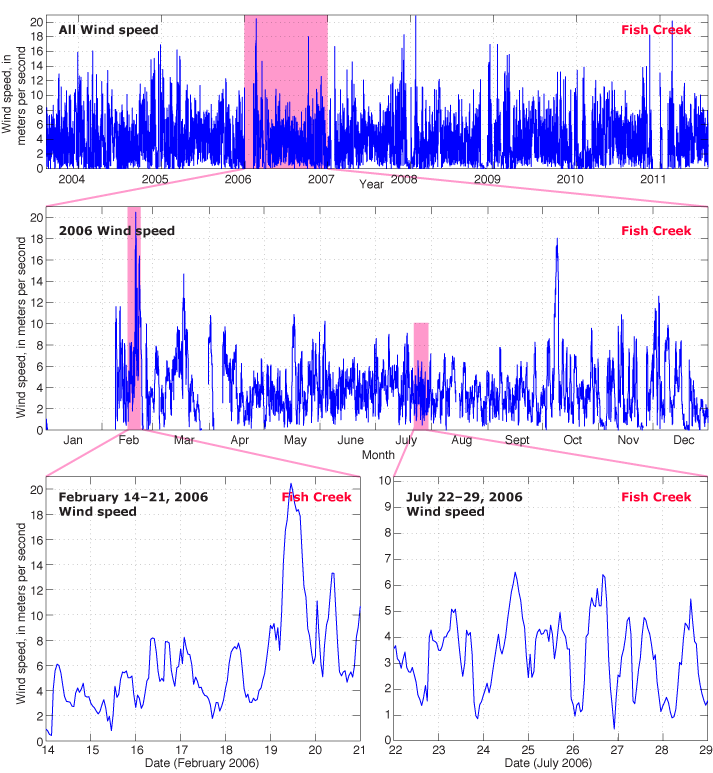
Figure 4 shows the wind speed record from Fish Creek at hourly resolution. The top panel shows the full record, while the middle panel shows one full year and the lower panels show one week of summer data and one week of winter data. Seasonal patterns are evident with the strongest wind events occurring during winter and the most consistent wind speeds occurring during the summer. The strongest winds, which are related to passing weather systems, are about 20 m s-1 at this site. Occasional gaps in the sub-0°C portion of the record (upper and middle panels) are due to significant ice buildup on the wind monitor; the data have been masked during these periods. As with air temperature, passing weather systems are the dominant source of wind speed variability during the winter (lower left panel). A diurnal signal is apparent in the summer wind speed variability (lower right panel).
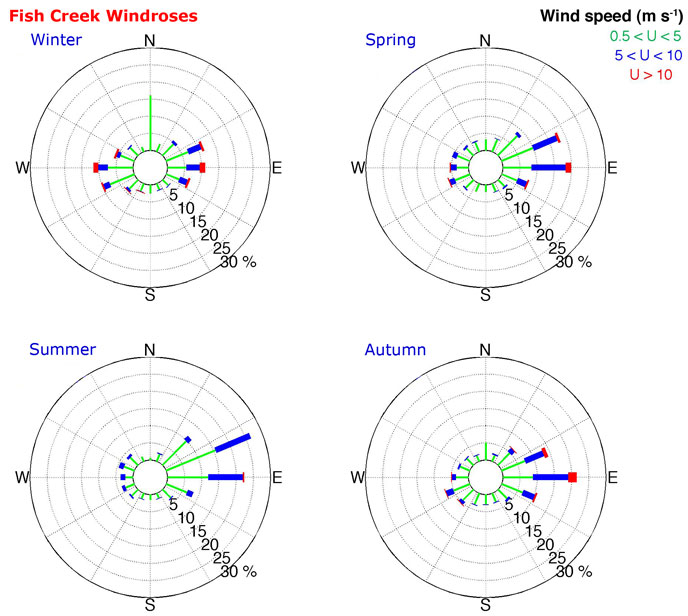
Figure 5 shows wind roses at the Fish Creek site for each of the four seasons: winter (December, January, February), spring (March, April, May), summer (June, July, August), and autumn (September, October, November). Wind roses are useful for showing how both wind speeds and directions are distributed at a particular site. For the DOI/GTN-P dataset, wind roses are calculated by dividing the wind direction into 16 categories (22.5° each) and the wind speed into 3 classes: (a) less than 5 m s-1, (b) between 5 m s-1 and 10 m s-1, and (c) greater than 10 m s-1. The wind roses show that winds at Fish Creek most frequently come out of the east and east-northeast. The strongest winds occur during the winter and tend to come out of the east with a secondary maximum out of the west. Strong winds also occur during the transition seasons, autumn and spring, again primarily coming out the east with a secondary maximum out of the west.
AcknowledgmentsThe authors thank and acknowledge all the staff of the Bureau of Land Management (BLM) Arctic Field Office and the U.S. Fish and Wildlife Service (FWS) Fairbanks Field Office whose steady logistical and scientific support has made this ongoing effort possible. In particular, we thank Don Meares, Richard Kemnitz, Shane Walker, Eric Yeager, Connie Adkins, Lon Kelly, and Stacie McIntosh at BLM, and Janet Jorgenson and David Payer at FWS. Specific thanks to Richard Pelltier and Jeremy Havens (USGS) for help with manuscript preparation and online publishing. Development of the DOI/GTN-P Observing Network was supported by the U.S. Geological Survey Global Change and Climate History Program (now the Climate and Land Use Change Research and Development Program).
References CitedArctic Council, 2005, Arctic climate impact assessment—Scientific report: Cambridge and New York, Cambridge University Press, 1046 p.Chapman, W.L., and Walsh, J.E., 2007, Simulations of Arctic temperature and pressure by global coupled models: Journal of Climate, v. 20, p. 609–632. Clow, G.D., DeGange, A.R., Derksen, D.V., and Zimmerman, C.E., 2011, Climate change considerations, chapter 4 of Holland-Bartels, Leslie, and Pierce, Brenda, eds., An evaluation of the science needs to inform decisions on Outer Continental Shelf energy development in the Chukchi and Beaufort Seas, Alaska: U.S. Geological Survey Circular 1370, p. 81–108. DeGange, A., Oakley, K., Irvine, G., Mayfield, G., Frenzel, S., Trawicki, J., Lassuy, D., Woodson, D., Talbot, S., and Wenburg, J., 2005, Future challenges project—Report on the Regional Workshop for Alaska, Washington, Idaho, and Oregon, June 1–2, 2005, Anchorage, Alaska: U.S. Fish and Wildlife Service and U.S. Geological Survey, 62 p. Houghton, J.T., Ding, Y., Griggs, D.J., Noguer, M., van der Linden, P.J., Dai, X., Maskell, K., and Johnson, C.A., eds., 2001, Climate Change 2001—The scientific basis. Contribution of Working Group I to the Third Assessment Report of the Intergovernmental Panel on Climate Change: Cambridge and New York, Cambridge University Press, 881 p. Jeffries, M.O., Richter-Menge, J.A., and Overland, J.E., eds., 2012, Arctic report card 2012: National Oceanic and Atmospheric Administration, Arctic Research Program, accessed September 1, 2012, at http://www.arctic.noaa.gov/reportcard. Lawrence, D.M., Slater, A.G., Tomas, R.A., Holland, M.M., and Deser, Clara, 2008, Accelerated Arctic land warming and permafrost degradation during rapid sea ice loss: Geophysical Research Letters, v. 35, L11506, doi:10.1029/2008GL033985. National Research Council, 2001, Climate change science—An analysis of some key questions: National Research Council–Committee on the Science of Climate Change, National Academies Press, 42 p. National Research Council, 2010, Advancing the science of climate change: National Research Council–Panel on Advancing the Science of Climate Change, National Academies Press, 528 p. Steinhart, J.S., and Hart, S.R., 1968, Calibration curves for thermistors: Deep-Sea Research, v. 15, p. 497–503. U.S. Arctic Research Commission, 2003, Climate change, permafrost, and impacts on civil infrastructure: U.S. Arctic Research Commission Permafrost Task Force, Special Report 01-03, 63 p. Walsh, J.E., 2008: Climate of the arctic marine environment: Ecological Applications, v. 18, no. 2 Supplement, p. S3–S22.
|
For additional information contact: |
|||||||||||||||||||||||||||||||||||||||||||||||||||||||||||||||||||||||||||||||||||||||||||||||||||||||||||||||||||||||||||||||||||||||||||||||||||||||||||

![]() U.S. Department of the Interior |
U.S. Geological Survey
U.S. Department of the Interior |
U.S. Geological Survey
URL: http://pubsdata.usgs.gov/pubs/of/2013/1063/Introduction.html
Page Contact Information: GS Pubs Web Contact
Page Last Modified: Monday, 29-Apr-2013 15:01:16 EDT