BC_seisimages: PNG format images of EdgeTech SB-512i chirp seismic-reflection data collected in May 2012 by the U.S. Geological Survey within the Baltimore Canyon, mid-Atlantic margin

Metadata also available as - [Outline] - [Parseable text] - [XML]

Frequently-anticipated questions:


What does this data set describe?

Title:
BC_seisimages: PNG format images of EdgeTech SB-512i chirp seismic-reflection data collected in May 2012 by the U.S. Geological Survey within the Baltimore Canyon, mid-Atlantic margin
Abstract:
A large number of high-resolution geophysical surveys between Cape Hatteras and Georges Bank have been conducted by federal, state, and academic institutions since the turn of the century. A major goal of these surveys is providing a continuous view of bathymetry and shallow stratigraphy at the shelf edge in order to assess levels of geological activity during the current sea level highstand. In 2012, chirp seismic-reflection data was collected by the U.S. Geologial Survey aboard the motor vessel Tiki XIV near three United States mid-Atlantic margin submarine canyons. These data can be used to further our understanding of passive continental margin processes during the Holocene, as well as providing valuable information regarding potential submarine geohazards. For more information on the U.S. Geological Survey involvement in this effort, see <http://woodshole.er.usgs.gov/operations/ia/public_ds_info.php?fa=2012-005-FA>.
  1. How should this data set be cited?

    U.S. Geological Survey, 2014, BC_seisimages: PNG format images of EdgeTech SB-512i chirp seismic-reflection data collected in May 2012 by the U.S. Geological Survey within the Baltimore Canyon, mid-Atlantic margin: Open-File Report 2014-1118, U.S. Geological Survey, Coastal and Marine Geology Program, Woods Hole Coastal and Marine Science Center, Woods Hole, Massachusetts.

    Online Links:

    This is part of the following larger work.

    Obelcz, Jeffrey, Brothers, Daniel S. , Uri S. ten Brink, Chaytor, Jason D. , Worley, Charles R. , and Moore, Eric M. , 2014, Chirp Seismic-Reflection Data From the Baltimore, Washington, and Norfolk Canyons, U.S. Mid-Atlantic Margin: Open-File Report 2014-1118, U.S. Geological Survey, Reston, VA.

    Online Links:

  2. What geographic area does the data set cover?

    West_Bounding_Coordinate: -74.043336
    East_Bounding_Coordinate: -73.719950
    North_Bounding_Coordinate: 38.325947
    South_Bounding_Coordinate: 37.872736

  3. What does it look like?

    <https://pubs.usgs.gov/of/2014/1118/data/Baltimore_Canyon/images/seisimage.jpg> (JPEG)
    Thumbnail of a sample seismic-reflection profile.

  4. Does the data set describe conditions during a particular time period?

    Beginning_Date: 23-May-2012
    Beginning_Time: 1011
    Ending_Date: 24-May-2012
    Ending_Time: 1126
    Currentness_Reference: ground condition

  5. What is the general form of this data set?

  6. How does the data set represent geographic features?

    1. How are geographic features stored in the data set?

      This is a Raster data set. It contains the following raster data types:

      • Dimensions, type Pixel

    2. What coordinate system is used to represent geographic features?

  7. How does the data set describe geographic features?


Who produced the data set?

  1. Who are the originators of the data set? (may include formal authors, digital compilers, and editors)

  2. Who also contributed to the data set?

  3. To whom should users address questions about the data?

    Jeffrey Obelcz
    U.S. Geological Survey
    Geologist
    384 Woods Hole Road
    Woods Hole, MA 02543-1598
    USA

    508-548-8700 x. 2245 (voice)
    508-457-2310 (FAX)
    jobelcz@usgs.gov


Why was the data set created?

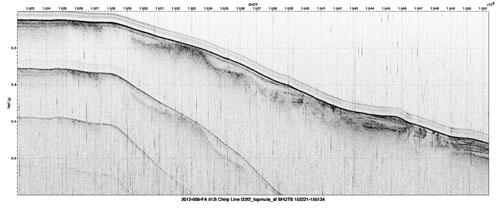
PNG images of each seismic profile were generated in order to enable incorporation of images of the seismic profiles into Geographic Information System (GIS) projects. The PNG images represent over 375 km of EdgeTech SB-512i chirp seismic-reflection profiles collected within and around Baltimore Canyon. These images are provided as a convenient and rapid method for viewing the seismic-reflection data.


How was the data set created?

  1. From what previous works were the data drawn?

    (source 1 of 1)
    U.S. Geological Survey, Unpublished Material, raw seismic data.

    Type_of_Source_Media: disc
    Source_Contribution:
    Seismic-reflection data acquisition: Chirp seismic data were collected using an EdgeTech SB-0512i towfish (0.5-4.5 kHz pulse, 50 ms pulse length, except for L19F3-L28F1, which were 0.5-2.7 kHz, 40 ms length), which was towed astern of the M/V Tiki XIV of Ocean City, MD. Chesapeake Technologies' SonarWiz (v.4.04.0031) seismic acquisition software was used to control the chirp, digitally log trace data in the SEG-Y Rev. 1 format (IEEE floating point), and record GPS navigation coordinates to the SEG-Y trace headers (in arc seconds of Latitude and Longitude, multiplied by a scalar of 100). Trace lengths are constant within lines, but vary from line to line due to variable water depth in the survey area (the minimum trace length was 250 ms and the maximum 1400 ms). This yields a range of samples per trace from approximately 5435 (250 ms trace length) to 30435 (1400 ms trace length). Sample interval was kept at a constant .000046 s. The ping rate was set to be consistent with the trace length, so it varied between 250 ms and 1400 ms.

  2. How were the data generated, processed, and modified?

    Date: Jun-2012 (process 1 of 4)
    SIOSEIS (version 2010.2.11) was used to mute the first 10 ms of each seismic trace of select lines (this process step is indicated in the line name by the _topmute suffix). SIOSEIS was then used to predict the vertical location of the sea floor for traces by identifying the first downtrace instance of an amplitude that exceeded a user-defined threshold value. This seafloor pick was then used by SIOSEIS process 'swell' to minimize the effect of sea surface heave. The output SEG-Y file is in the format <LxFx_topmute_sf>, and these files were then used to create browse images and digital interpretation.

    Person who carried out this activity:

    Jeffrey Obelcz
    U.S. Geological Survey
    Geologist
    384 Woods Hole Road
    Woods Hole, MA 02543-1598
    USA

    508-548-8700 x. 2245 (voice)
    jobelcz@usgs.gov

    Date: Jun-2012 (process 2 of 4)
    SEG-Y trace data of lines that SIOSEIS could not seafloor autopick (usually due to an acoustically faint seafloor-sediment interface) were imported into IHS Kingdom Suite (version 8.7.1), a digital seismic interpretation software. The seafloor was manually picked using an interactive horizon digitizer tool, and seafloor horizons for these lines were exported as trace-time (one-way travel time) pair ASCII text files.

    Person who carried out this activity:

    Jeffrey Obelcz
    U.S. Geological Survey
    Geologist
    384 Woods Hole Road
    Woods Hole, MA 02543-1598
    USA

    508-548-8700 x. 2245 (voice)
    jobelcz@usgs.gov

    Date: Jun-2012 (process 3 of 4)
    SIOSEIS is used to insert the trace-time pairs exported from Kingdom Suite (detailed in process step 2) into the SEG-Y trace headers and minimize the effect of sea surface heave using process 'swell'. The output files are in the format <LxFx_sf> (images that are in the format LxFx_topmute_sf described in process step 1 did not need to be manually picked in Kingdom Suite), and were the SEG-Y files used for creation of browse images and digital interpretation.

    Person who carried out this activity:

    Jeffrey Obelcz
    U.S. Geological Survey
    Geologist
    384 Woods Hole Road
    Woods Hole, MA 02543-1598
    USA

    508-548-8700 x. 2245 (voice)
    jobelcz@usgs.gov

    Date: May-2013 (process 4 of 4)
    Seismic Unix (version 4.2) was used to read all SEG-Y files produced in process steps 1 and 3 and write a Seismic Unix file for each corresponding SEG-Y file. Seismix Unix was then used to plot the SU files as 8 bit grayscale Postscript files using the SU 'psimage' algorithm. Images were created with a variable horizontal scale and variable TWTT depending on trace length of a given line. Each image is not representative of the entire SEG-Y file; the top and bottom of each profile is cropped to only display areas of subbottom penetration. Postscript images were converted to PNG format using ImageMagick (version 6.7.0). The x-axis of the images represents ffid and the y-axis is two-way travel time in seconds.

    Person who carried out this activity:

    Jeffrey Obelcz
    U.S Geological Survey
    Geologist
    384 Woods Hole Road
    Woods Hole, MA 02543-1598
    USA

    508-548-8700 x. 2245 (voice)
    jobelcz@usgs.gov

  3. What similar or related data should the user be aware of?

    Stockwell, John, 2011, Seismic Uni*x: Center for Wave Phenomena - Colorado School of Mines, Golden, CO.

    Online Links:

    Henkart, Paul, 2011, SIOSEIS: Scripps Institution of Oceanography, UC San Diego, La Jolla, CA.

    Online Links:

    Michael W. Norris and Alan K. Faichney, 2002, SEGY Rev. 1 Data Exchange Format 1: Society of Exploration Geophysicists, Tulsa, OK.

    Online Links:


How reliable are the data; what problems remain in the data set?

  1. How well have the observations been checked?

  2. How accurate are the geographic locations?

  3. How accurate are the heights or depths?

  4. Where are the gaps in the data? What is missing?

    Lines were serially recorded during the survey in the format "LXF1". When a file is named "LXF2" or has a file number greater than 2, the recording parameters were usually changed (record length and shot rate), as recorded in the ship's log. The following lines were either not recorded or excluded from this data release: L3F2 (negligible length), L4F1 (line name error, never recorded), L15F1 (negligible length), L25F2 (small, noisy, no features of interest), L47F1 (negligible length).

  5. How consistent are the relationships among the observations, including topology?

    Processed seismic data were converted to PNG format for ease of seismic trace display. Quality control was conducted during processing.


How can someone get a copy of the data set?

Are there legal restrictions on access or use of the data?

Access_Constraints: None.
Use_Constraints:
Public domain data from the U.S. Government are freely redistributable with proper metadata and source attribution. Please recognize the U.S. Geological Survey as the source of this information.

  1. Who distributes the data set? (Distributor 1 of 1)

    Jeffrey Obelcz
    U.S. Geological Survey
    Geologist
    384 Woods Hole Road
    Woods Hole, MA 02543
    USA

    508-548-8700 x. 2245 (voice)
    jobelcz@usgs.gov

  2. What's the catalog number I need to order this data set?

    Downloadable Data

  3. What legal disclaimers am I supposed to read?

    Neither the U.S. Government, the Department of the Interior, nor the USGS, nor any of their employees, contractors, or subcontractors, make any warranty, express or implied, nor assume any legal liability or responsibility for the accuracy, completeness, or usefulness of any information, apparatus, product, or process disclosed, nor represent that its use would not infringe on privately owned rights. The act of distribution shall not constitute any such warranty, and no responsibility is assumed by the USGS in the use of these data or related materials. Any use of trade, product, or firm names is for descriptive purposes only and does not imply endorsement by the U.S. Government.

  4. How can I download or order the data?

  5. What hardware or software do I need in order to use the data set?

    These data can be viewed with any PNG image viewing software. The zip files must be uncompressed in order to view the PNG images.


Who wrote the metadata?

Dates:
Last modified: 14-May-2013
Metadata author:
Jeffrey Obelcz
U.S. Geological Survey
Geologist
384 Woods Hole Road
Woods Hole, MA 02543-1598
USA

508-457-2245 (voice)
508-457-2310 (FAX)
jobelcz@usgs.gov

Metadata standard:
FGDC Content Standards for Digital Geospatial Metadata (FGDC-STD-001-1998)


Generated by mp version 2.9.6 on Tue Jun 24 09:28:42 2014