FISC - St. Petersburg
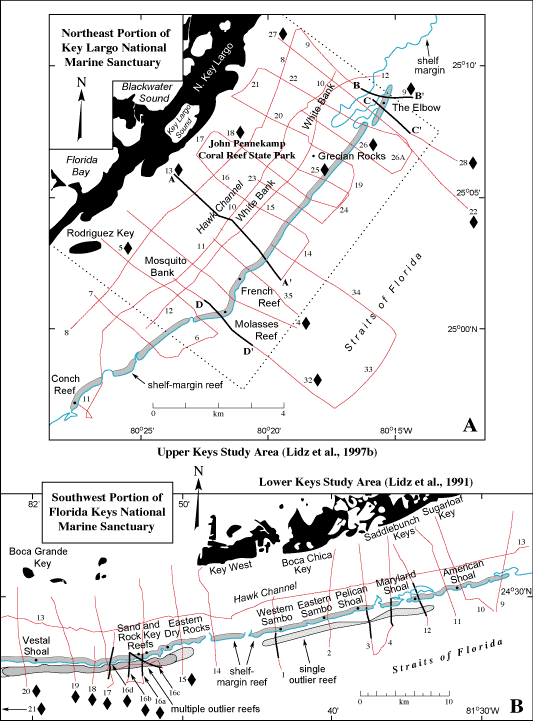
Figure 91. (A) Upper Keys study area of Lidz et al. (1997b) showing numbered August 1991 seismic tracklines (red) and boundaries of John Pennekamp Coral Reef State Park (black dotted lines). Bold black parts of lines 13, 9, 28, and 32 indicate areas of seismic profiles A-A', B-B', C-C', and D-D', respectively, in Lidz et al. (1997a, their figs. 7 and 8). Diamonds indicate lines along which profile sections at the margin were used to construct block diagrams showing Holocene flooding of the upper Keys margin (Tile 7/8). Note reentrant (pass) through the shelf-edge reef south of The Elbow, discussed in Lidz et al. (1997a). (B) Lower Keys study area of Lidz et al. (1991) showing numbered July 1989 seismic lines (red) and areas of highly developed, multiple, outlier reefs detected in the seismic data (dark shading, well developed; light shading, less well developed; Fig. 18). Subsequent to the 1991 study, four tracts of outlier reefs were documented photographically in Lidz et al. (2003). Bold black parts of tracklines indicate seismic-profile sections illustrated in Lidz et al. (1991). Diamonds indicate lines along which profile sections were used to construct block diagrams depicting flooding of the lower Keys margin (Tile 7/8). Blue line marks 30-m-depth contour of shelf margin.
|
Can't see the printable PDF version? Get the free Adobe Acrobat® Reader. |

![]() U.S. Department of the Interior |
U.S. Geological Survey
U.S. Department of the Interior |
U.S. Geological Survey
URL: [disc] /pubs/pp/2007/1751/professional-paper/tile6/figures/fig91.html
Page Contact Information: Feedback
Page Last Modified: December 01, 2016 @ 04:14 PM (JSS)
