Professional Paper 1386–A
Select image for high resolution and Save to download 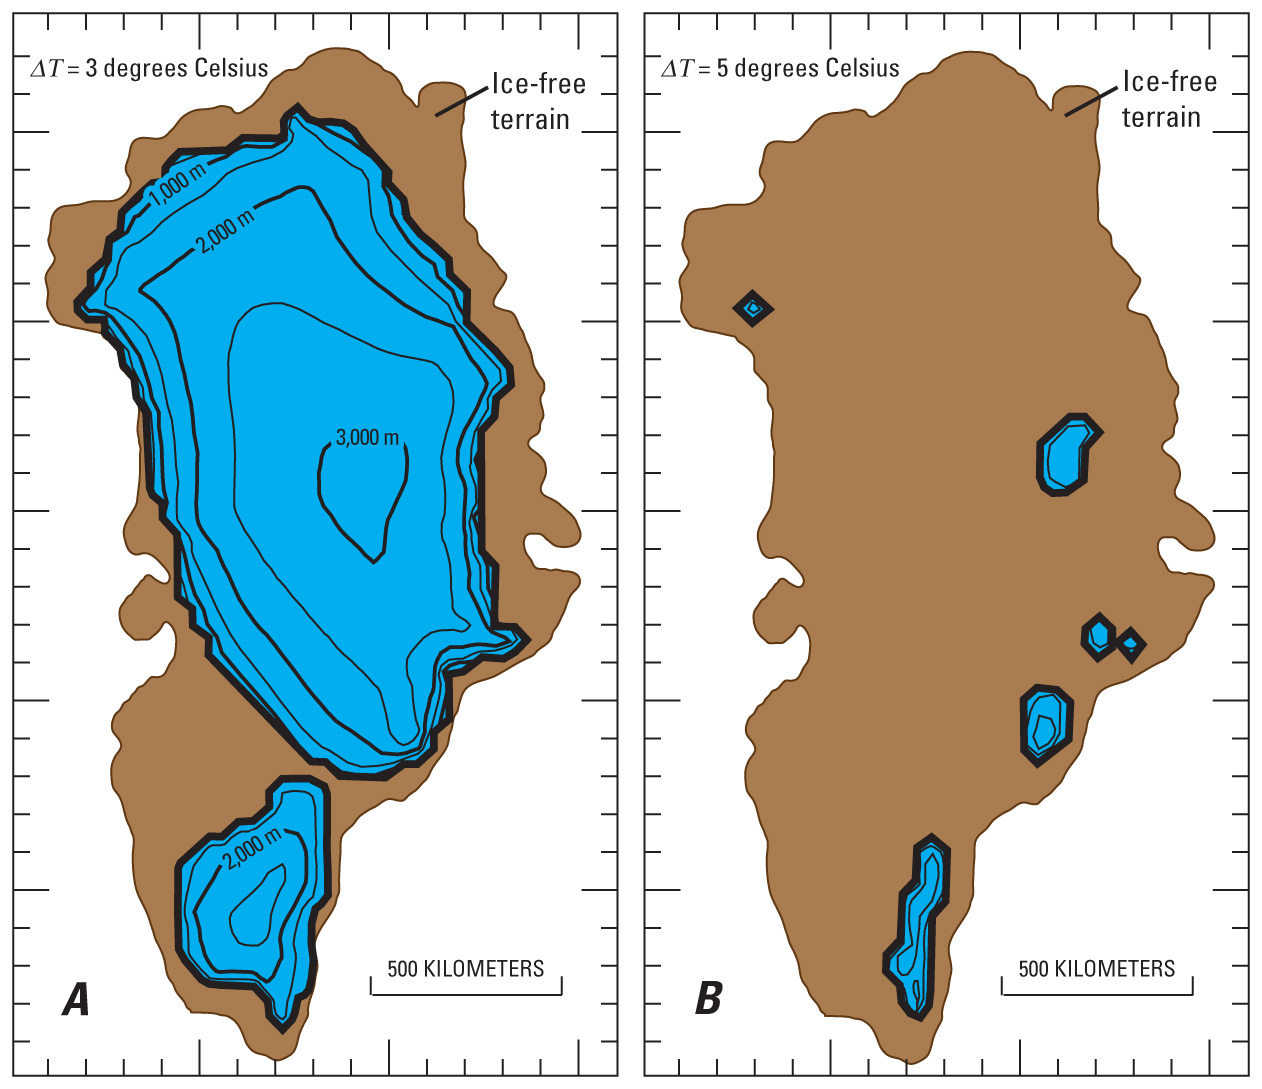 Figure 19. Maps of the Greenland ice sheet modeled for two warmer steady-state climates. A, +3°C, and B, +5°C. Snow accumulation was allowed to remain within the range of present-day distribution. Modified from Fabre and others (1995, p. 5, fig. 3). |

![]() U.S. Department of the Interior |
U.S. Geological Survey
U.S. Department of the Interior |
U.S. Geological Survey
URL: http://pubsdata.usgs.gov/pubs/pp/p1386a/gallery2-fig19.html
Page Contact Information: GS Pubs Web Contact
Page Last Modified: Thursday, 01-Dec-2016 16:25:00 EST
