Professional Paper 1386–A
Select image for high resolution and Save to download 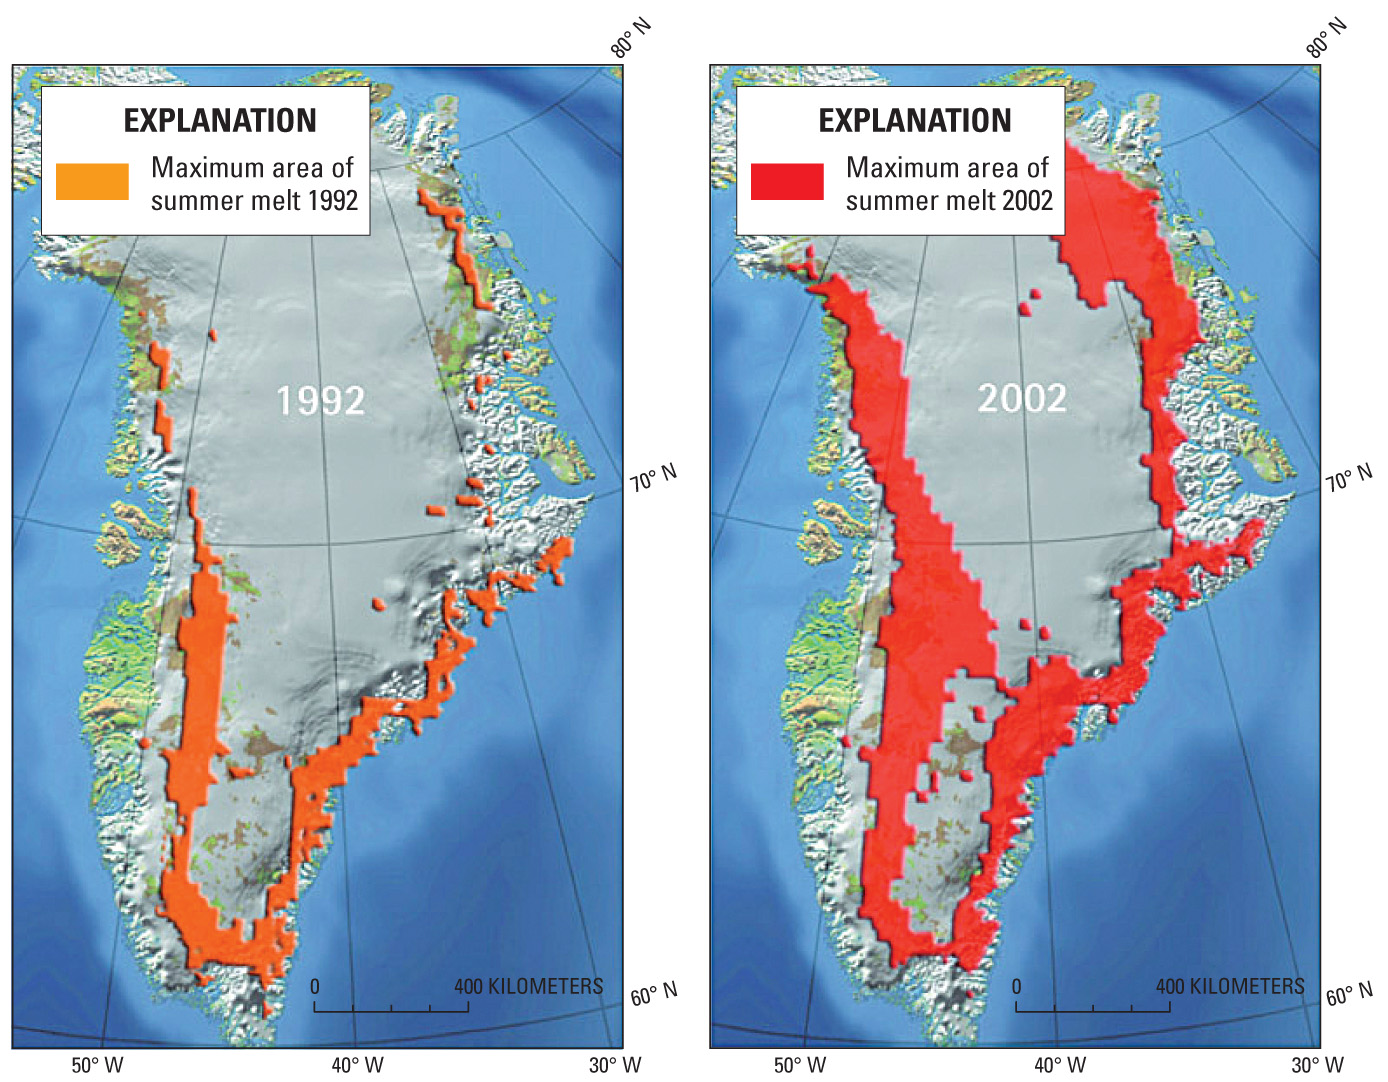 Figure 20. Maximum area of summer melt on the surface of the Greenland ice sheet in 1992 and as of 2002. Modified from K. Steffan in Arctic Climate Impact Assessment (ACIA) (2004, p. 40; 2005, p. 205, fig. 618). |

![]() U.S. Department of the Interior |
U.S. Geological Survey
U.S. Department of the Interior |
U.S. Geological Survey
URL: http://pubsdata.usgs.gov/pubs/pp/p1386a/gallery2-fig20.html
Page Contact Information: GS Pubs Web Contact
Page Last Modified: Thursday, 01-Dec-2016 16:25:01 EST
