Professional Paper 1386–A
Select image for high resolution and Save to download 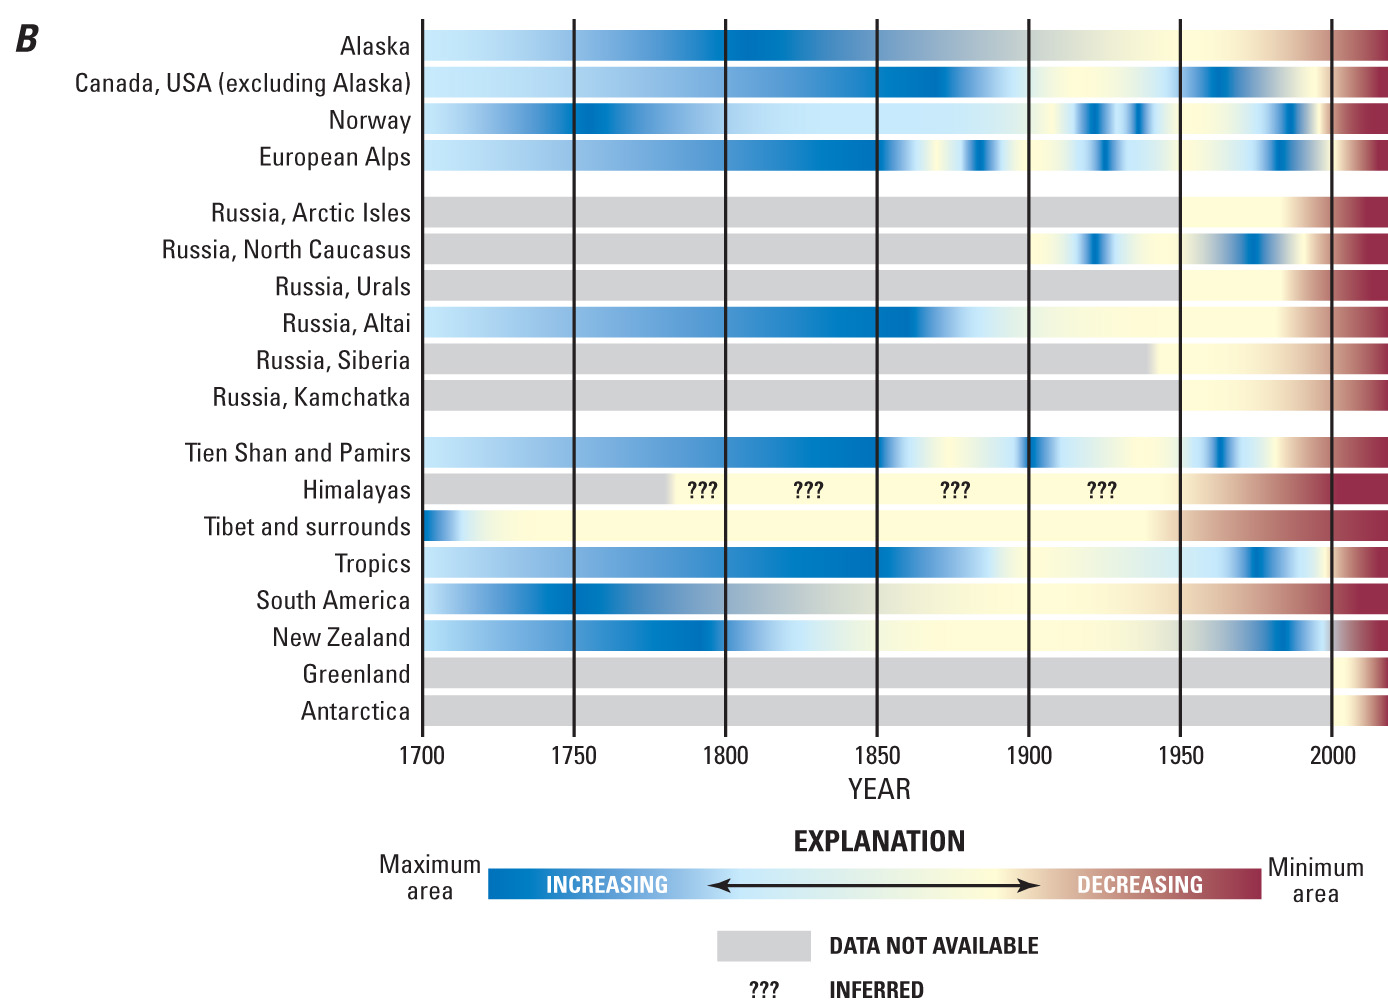 Figure 25. B, Color-coded bar graphs showing decreasing glacierized areas in the main geographic regions. Changes in the area of the Antarctic ice sheet are seen primarily as retreat of ice shelves on the Antarctic Peninsula. Changes in the area of the Greenland ice sheet are seen as increased area of summer melt (water) on the surface of the ice sheet. Modified from Zemp and others (2007, p. 132–133, fig. 6B.11b). |

![]() U.S. Department of the Interior |
U.S. Geological Survey
U.S. Department of the Interior |
U.S. Geological Survey
URL: http://pubsdata.usgs.gov/pubs/pp/p1386a/gallery2-fig25b.html
Page Contact Information: GS Pubs Web Contact
Page Last Modified: Thursday, 01-Dec-2016 16:25:04 EST
