Professional Paper 1386–A
Select image for high resolution and Save to download 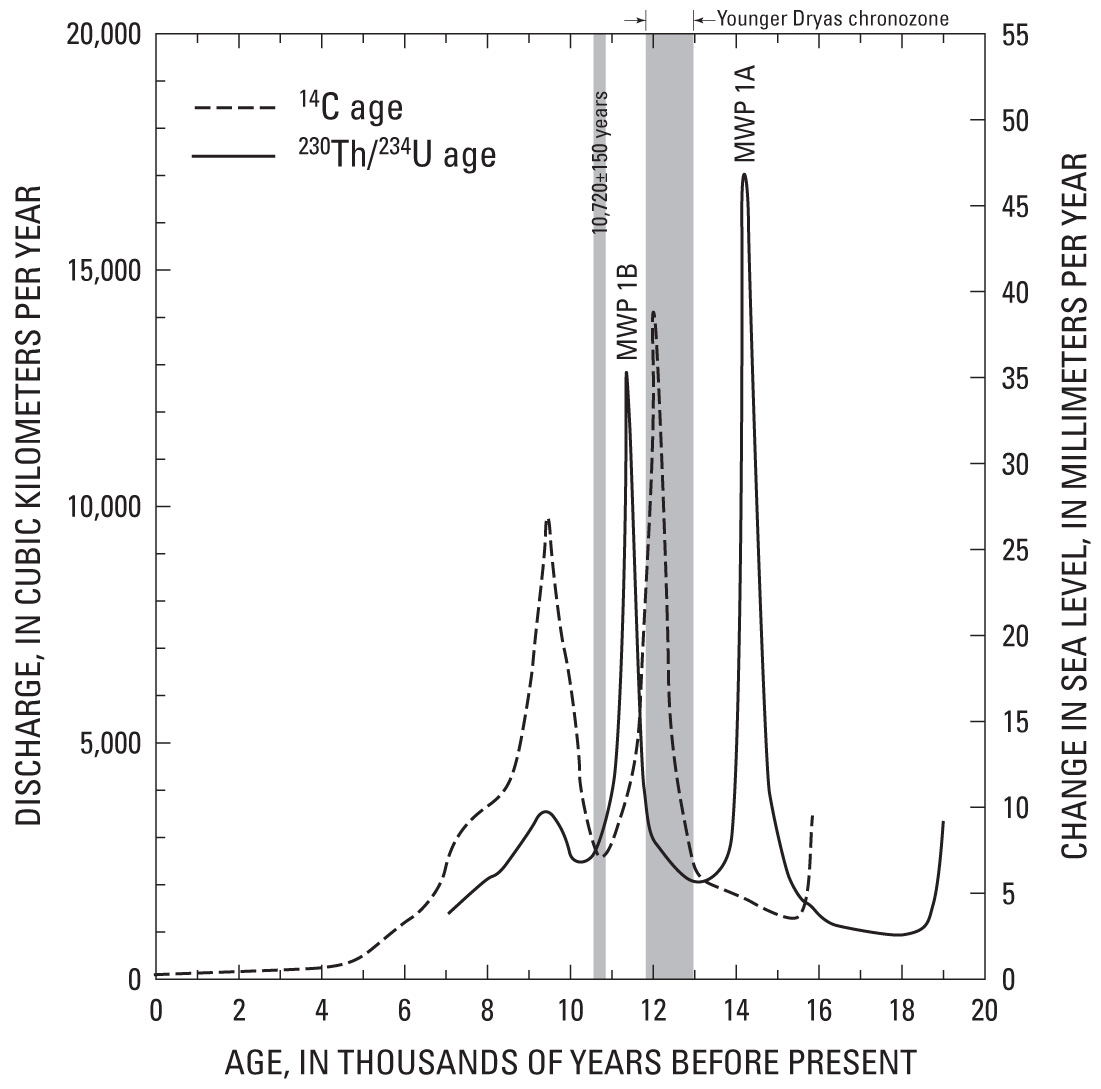 Figure 26. Annual discharge rate of glacial meltwater emanating from rapidly melting ice sheets at the end of the Pleistocene Epoch and near the beginning of the Holocene Epoch, plotted against the annual rate of rise in eustatic sea level. The 230Th/234U-dated sea-level curve is shown with a solid line. The 14C-dated sea-level curve is shown by a dashed line; it is not corrected for changes in production of 14C. The meltwater pulse IB coincides with the 1,787 m δ18O anomaly in the ice core from the Dye 3 site in the Greenland ice sheet (10,720±150 years layer-counting calendar age) based on the 230Th/234U calendar chronology. The Younger Dryas chronozone is shown by a shaded pattern (see fig. 35). Modified from Fairbanks (1990, p. 943, fig. 3). |

![]() U.S. Department of the Interior |
U.S. Geological Survey
U.S. Department of the Interior |
U.S. Geological Survey
URL: http://pubsdata.usgs.gov/pubs/pp/p1386a/gallery2-fig26.html
Page Contact Information: GS Pubs Web Contact
Page Last Modified: Thursday, 01-Dec-2016 16:25:05 EST
